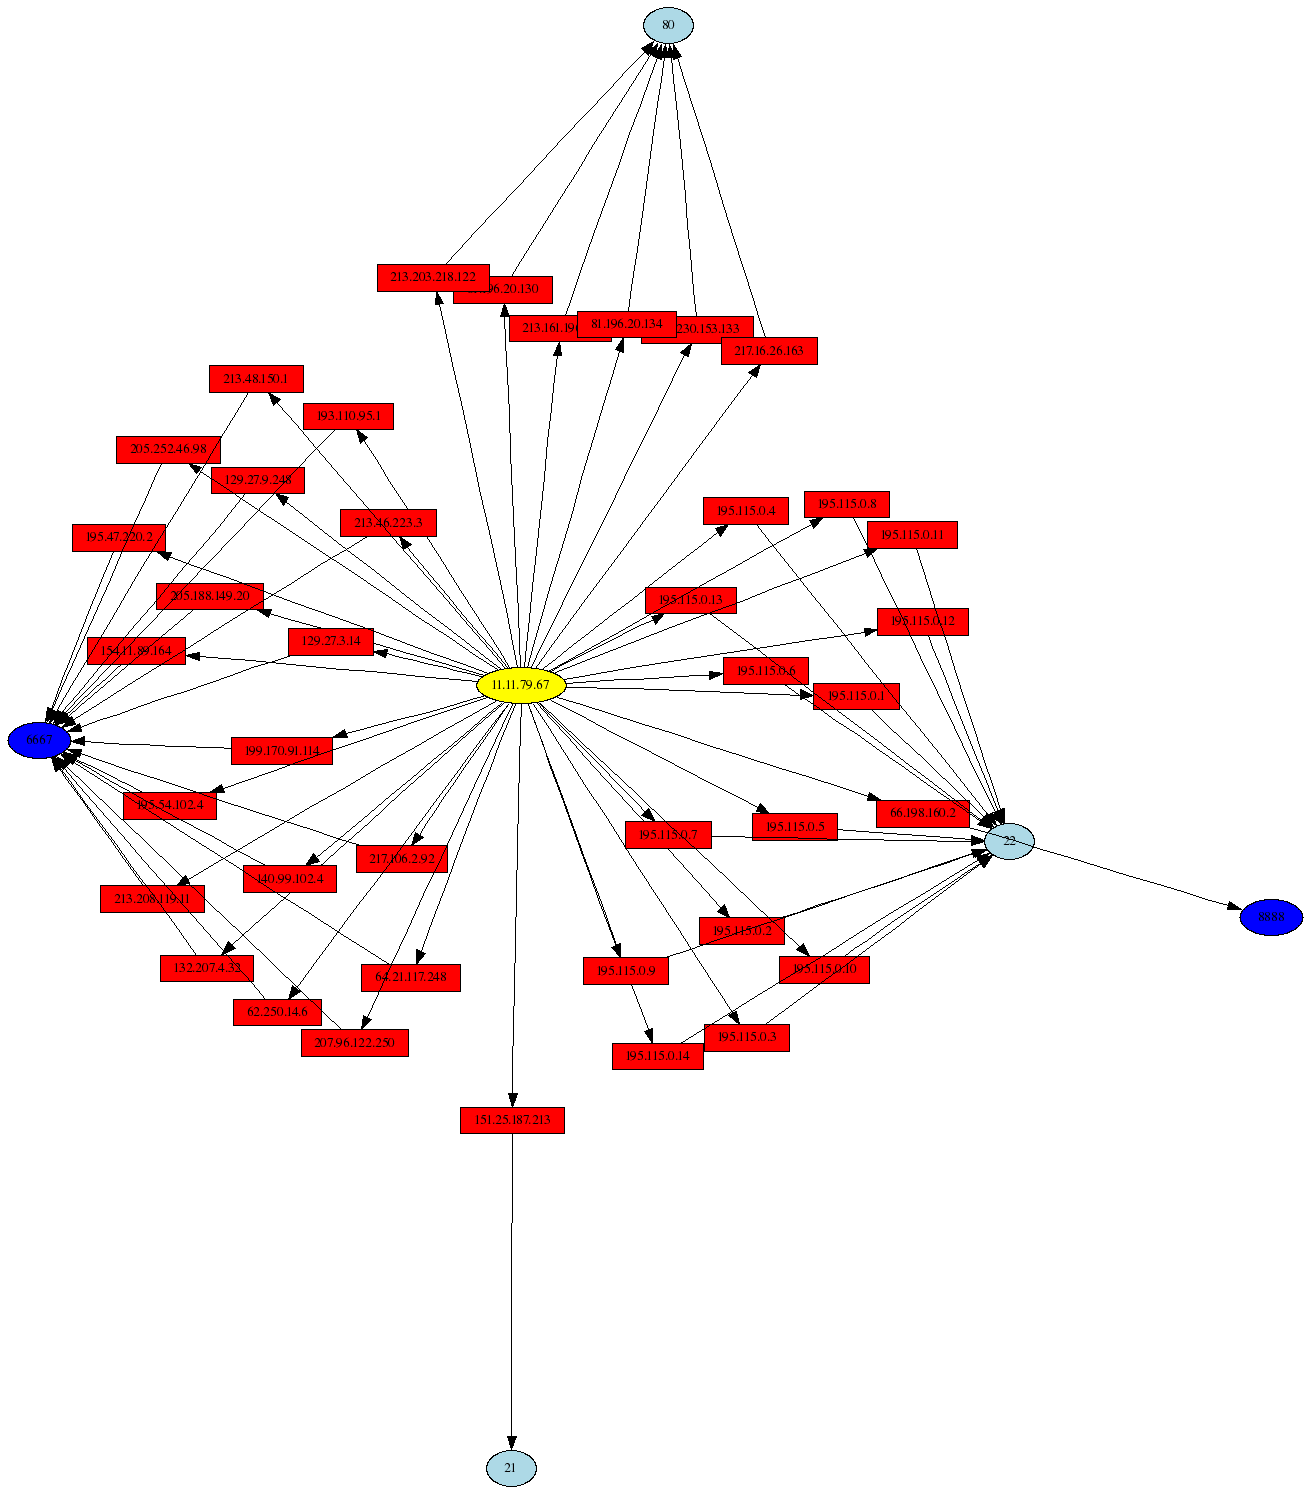
Chapter 14: iptables Log Visualization
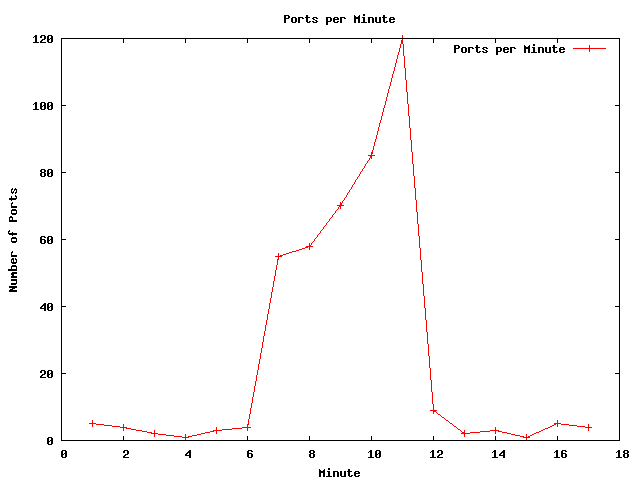
Below are all visualizations of iptables log data within Chapter 14:Traffic Spike: Number of packets to ports per minute
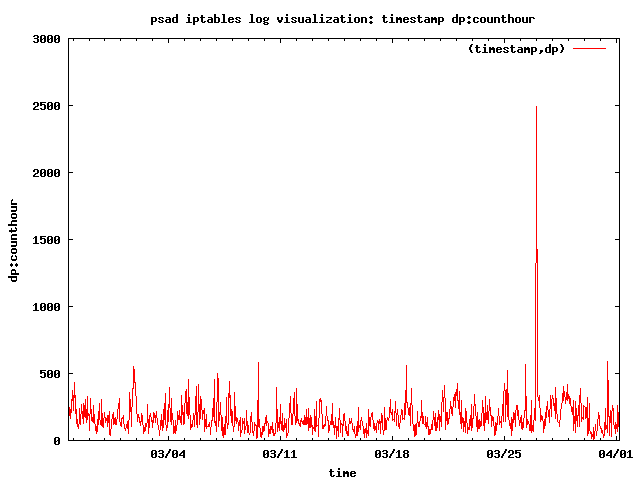
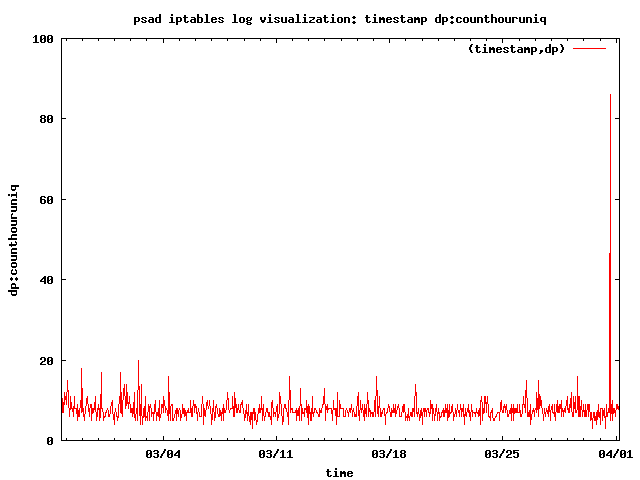
Traffic Spike: Number of SYN packets to ports per hour
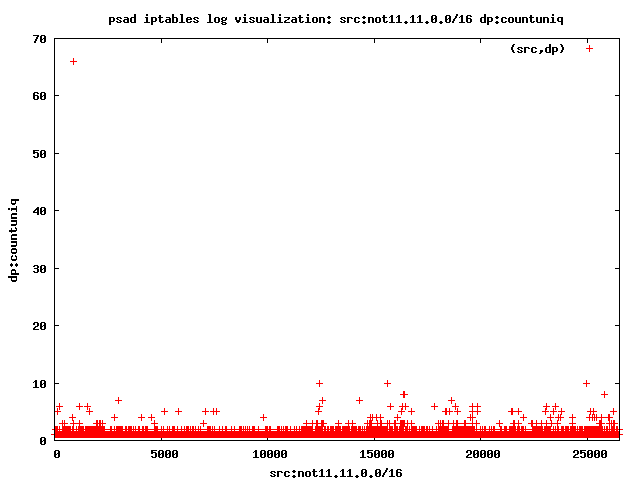
Port Scan: Source IP addresses vs. number of unique ports
Port Scan: Time vs. unique ports
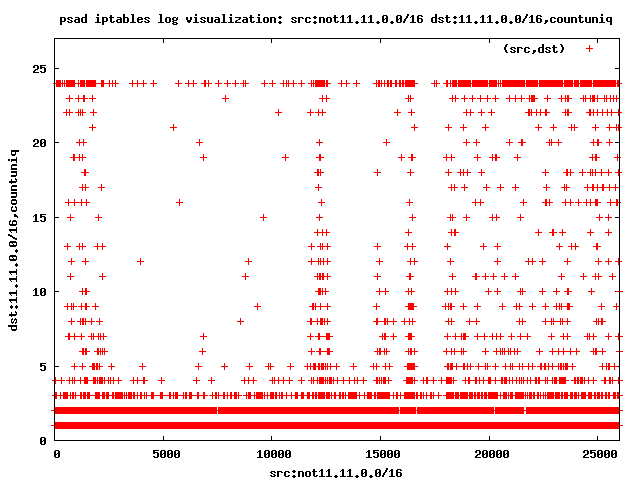
Port Sweep: External sources vs. number of unique local destinations
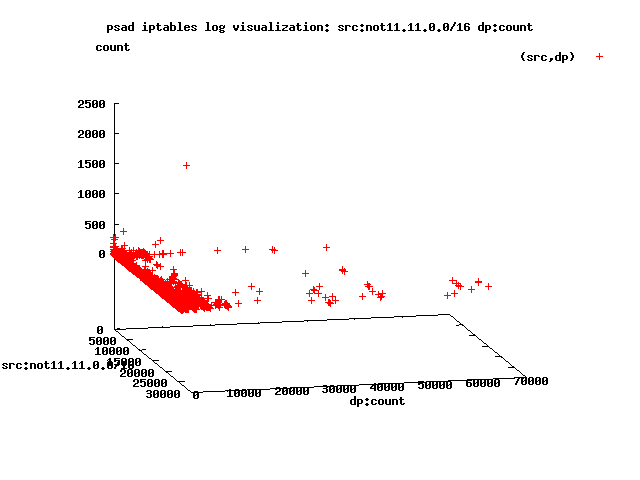
Port Sweep (3D): External source addresses vs. destination ports vs. packet counts
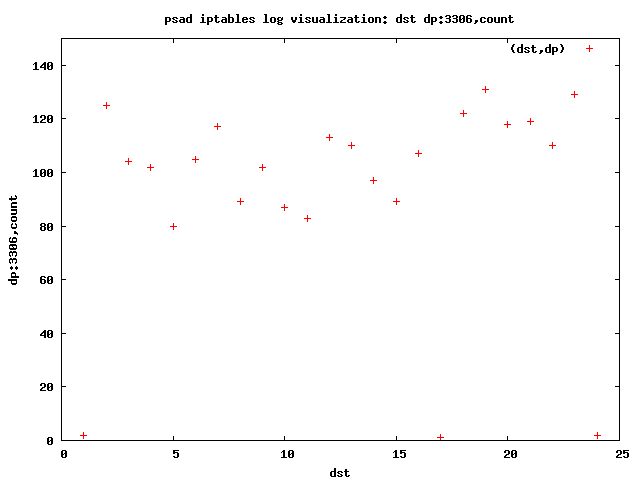
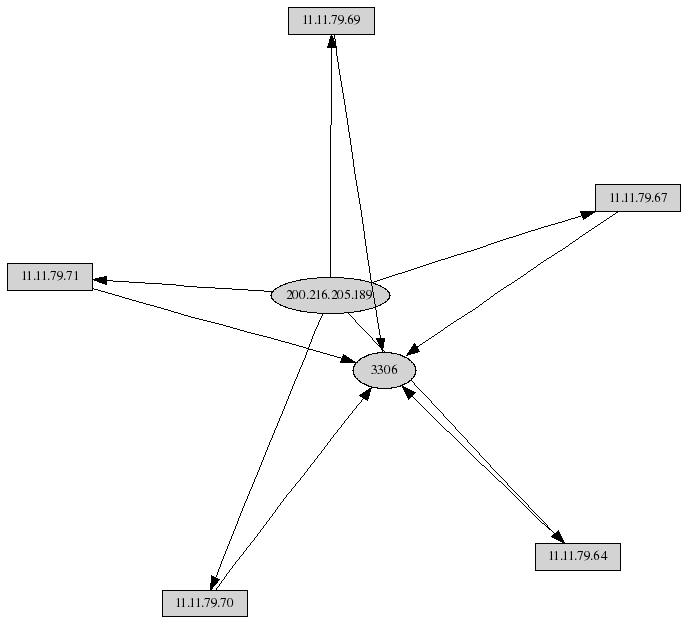
Port Sweep: MySQL 3306
Link graph of MySQL port sweep
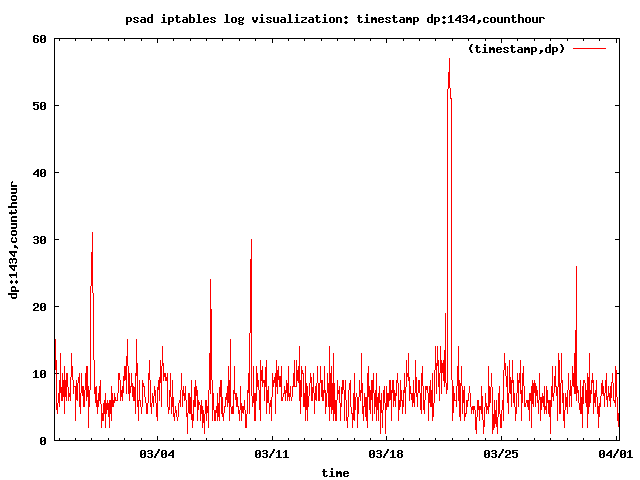
Slammer worm: packet counts by the hour
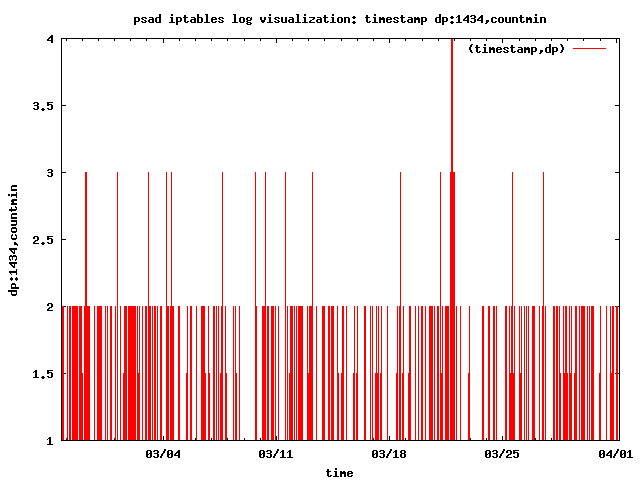
Slammer worm: packet counts by the minute
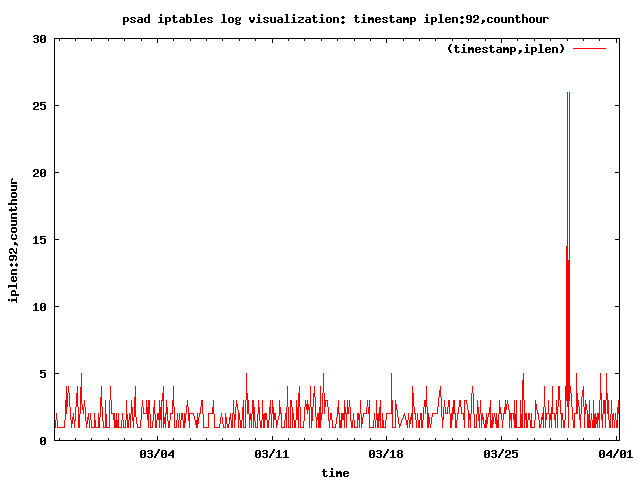
Nachi worm traffic by the hour
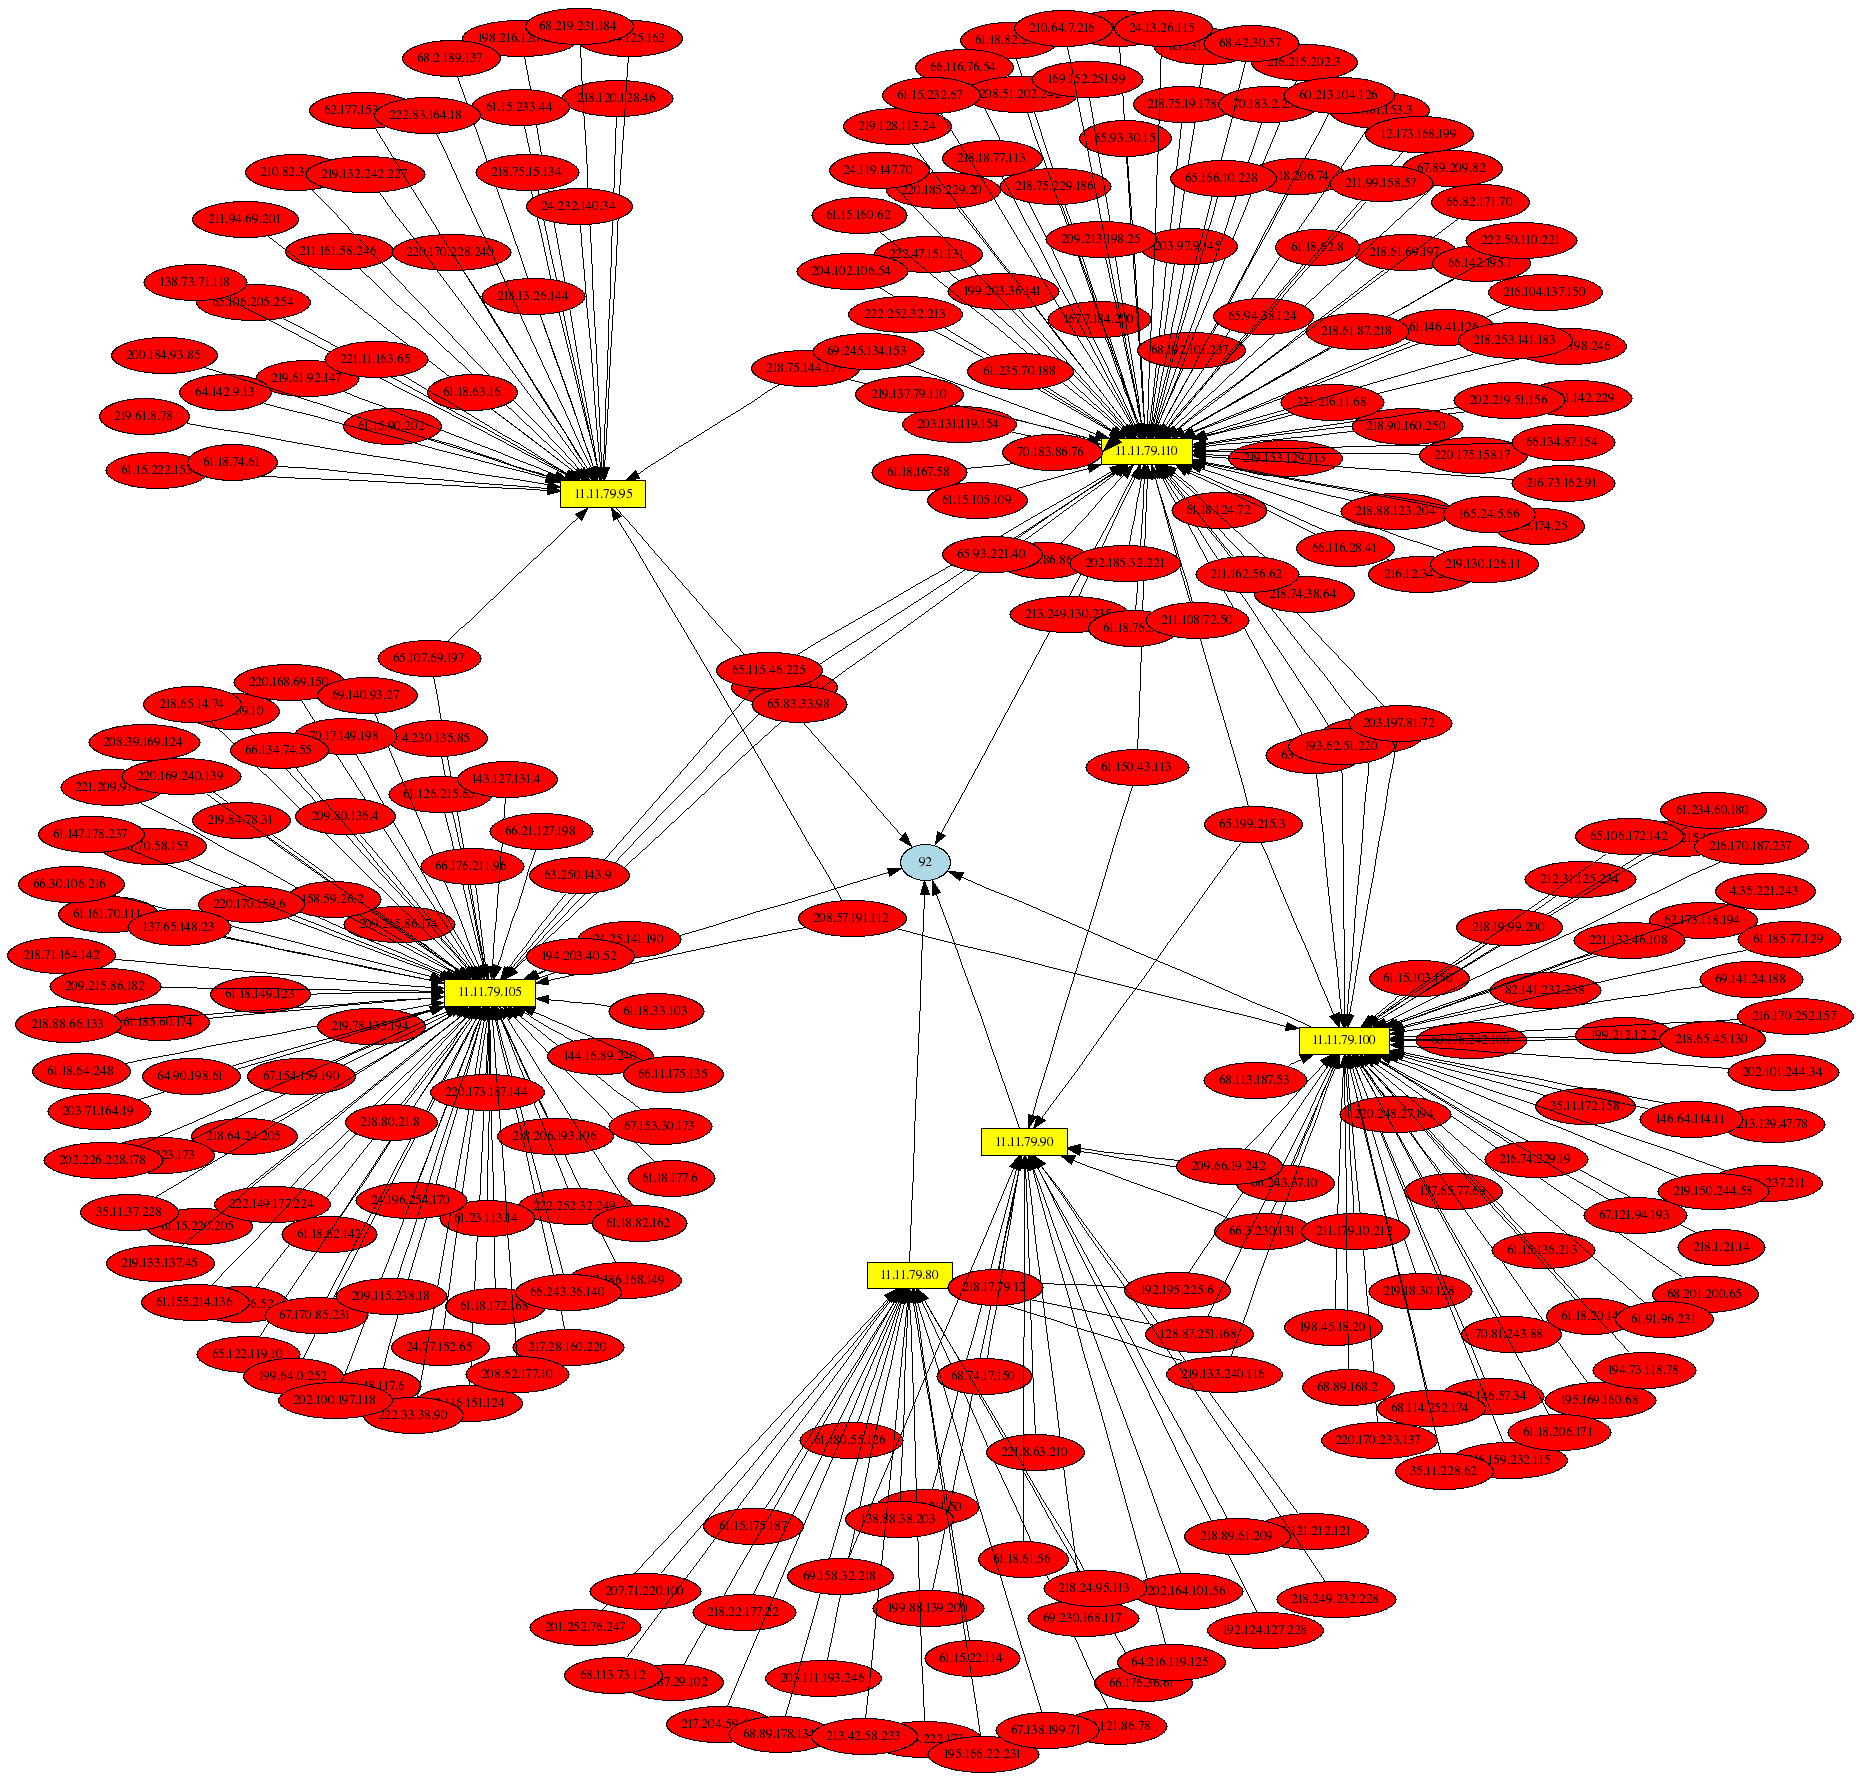
Link graph of Nachi worm 92-byte ICMP packets
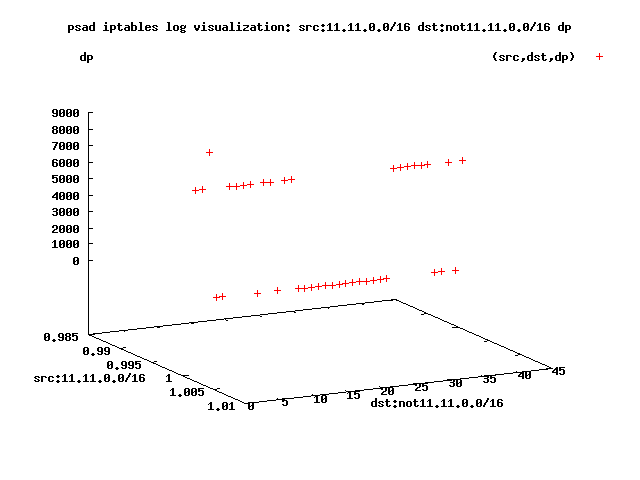
Compromised Honeynet system: Point graph of outbound connections
Compromised Honeynet system: Link graph of outbound connections
