cipherdyne.org

Michael Rash, Security Researcher


Programming    [Summary View]

Integrating fwknop with the 'American Fuzzy Lop' Fuzzer

Over the past few months, the American Fuzzy Lop (AFL) fuzzer written by Michal Zalewski has become a tour de force in the security field. Many interesting bugs have been found, including a late breaking bug in the venerable cpio utility that Michal announced to the full-disclosure list. It is clear that AFL is succeeding perhaps where other fuzzers have either failed or not been applied, and this is an important development for anyone trying to maintain a secure code base. That is, the ease of use coupled with powerful fuzzing strategies offered by AFL mean that open source projects should integrate it directly into their testing systems. This has been done for the fwknop project with some basic scripting and one patch to the fwknop code base. The patch was necessary because according to AFL documentation, projects that leverage things like encryption and cryptographic signatures are not well suited to brute force fuzzing coverage, and fwknop definitely fits into this category. Crypto being a fuzzing barrier is not unique to AFL - other fuzzers have the same problem. So, similarly to the libpng-nocrc.patch included in the AFL sources, encryption, digests, and base64 encoding are bypassed when fwknop is compiled with --enable-afl-fuzzing on the configure command line. One doesn't need to apply the patch manually - it is built directly into fwknop as of the 2.6.4 release. This is in support of a major goal for the fwknop project which is comprehensive testing.

If you maintain an open source project that involves crypto and does any sort of encoding/decoding/parsing gated by crypto operations, then you should patch your project so that it natively supports fuzzing with AFL through an optional compile time step. As an example, here is a portion of the patch to fwknop that disables base64 encoding by just copying data manually:
diff --git a/lib/base64.c b/lib/base64.c
index b8423c2..5b51121 100644
--- a/lib/base64.c
+++ b/lib/base64.c
@@ -36,6 +36,7 @@
 int
 b64_decode(const char *in, unsigned char *out)
 {
-    int i, v;
+    int i;
     unsigned char *dst = out;
-
+#if ! AFL_FUZZING
+    int v;
+#endif
+
+#if AFL_FUZZING
+    /* short circuit base64 decoding in AFL fuzzing mode - just copy
+     * data as-is.
+    */
+    for (i = 0; in[i]; i++)
+        *dst++ = in[i];
+#else
     v = 0;
     for (i = 0; in[i] && in[i] != '='; i++) {
         unsigned int index= in[i]-43;
@@ -68,6 +80,7 @@ b64_decode(const char *in, unsigned char *out)
         if (i & 3)
             *dst++ = v >> (6 - 2 * (i & 3));
     }
+#endif

     *dst = '\0';
Fortunately, so far all fuzzing runs with AFL have turned up zero issues (crashes or hangs) with fwknop, but the testing continues.

Within fwknop, a series of wrapper scripts are used to fuzz the following four areas with AFL. These areas represent the major places within fwknop where data is consumed either via a configuration file or from over the network in the form of an SPA packet:

  1. SPA packet encoding/decoding: spa-pkts.sh
  2. Server access.conf parsing: server-access.sh
  3. Server fwknopd.conf parsing: server-conf.sh
  4. Client fwknoprc file parsing: client-rc.sh
Each wrapper script makes sure fwknop is compiled with AFL support, executes afl-fuzz with the corresponding test cases necessary for good coverage, archives previous fuzzing output data, and supports resuming of previously stopped fuzzing jobs. Here is an example where the SPA packet encoding/decoding routines are fuzzed with AFL after fwknop is compiled with AFL support:
$ cd fwknop.git/test/afl/
$ ./compile/afl-compile.sh
$ ./fuzzing-wrappers/spa-pkts.sh
+ ./fuzzing-wrappers/helpers/fwknopd-stdin-test.sh
+ SPA_PKT=1716411011200157:root:1397329899:2.0.1:1:127.0.0.2,tcp/22:AAAAA
+ LD_LIBRARY_PATH=../../lib/.libs ../../server/.libs/fwknopd -c ../conf/default_fwknopd.conf -a ../conf/default_access.conf -A -f -t
Warning: REQUIRE_SOURCE_ADDRESS not enabled for access stanza source: 'ANY'+ echo -n 1716411011200157:root:1397329899:2.0.1:1:127.0.0.2,tcp/22:AAAAA

SPA Field Values:
=================
   Random Value: 1716411011200157
       Username: root
      Timestamp: 1397329899
    FKO Version: 2.0.1
   Message Type: 1 (Access msg)
 Message String: 127.0.0.2,tcp/22
     Nat Access: <NULL>
    Server Auth: <NULL>
 Client Timeout: 0
    Digest Type: 3 (SHA256)
      HMAC Type: 0 (None)
Encryption Type: 1 (Rijndael)
Encryption Mode: 2 (CBC)
   Encoded Data: 1716411011200157:root:1397329899:2.0.1:1:127.0.0.2,tcp/22
SPA Data Digest: AAAAA
           HMAC: <NULL>
 Final SPA Data: 200157:root:1397329899:2.0.1:1:127.0.0.2,tcp/22:AAAAA

SPA packet decode: Success
+ exit 0
+ LD_LIBRARY_PATH=../../lib/.libs afl-fuzz -T fwknopd,SPA,encode/decode,00ffe19 -t 1000 -i test-cases/spa-pkts -o fuzzing-output/spa-pkts.out ../../server/.libs/fwknopd -c ../conf/default_fwknopd.conf -a ../conf/default_access.conf -A -f -t
afl-fuzz 0.66b (Nov 23 2014 22:29:48) by <lcamtuf@google.com>
[+] You have 1 CPU cores and 2 runnable tasks (utilization: 200%).
[*] Checking core_pattern...
[*] Setting up output directories...
[+] Output directory exists but deemed OK to reuse.
[*] Deleting old session data...
[+] Output dir cleanup successful.
[*] Scanning 'test-cases/spa-pkts'...
[*] Creating hard links for all input files...
[*] Validating target binary...
[*] Attempting dry run with 'id:000000,orig:spa.start'...
[*] Spinning up the fork server...
[+] All right - fork server is up.
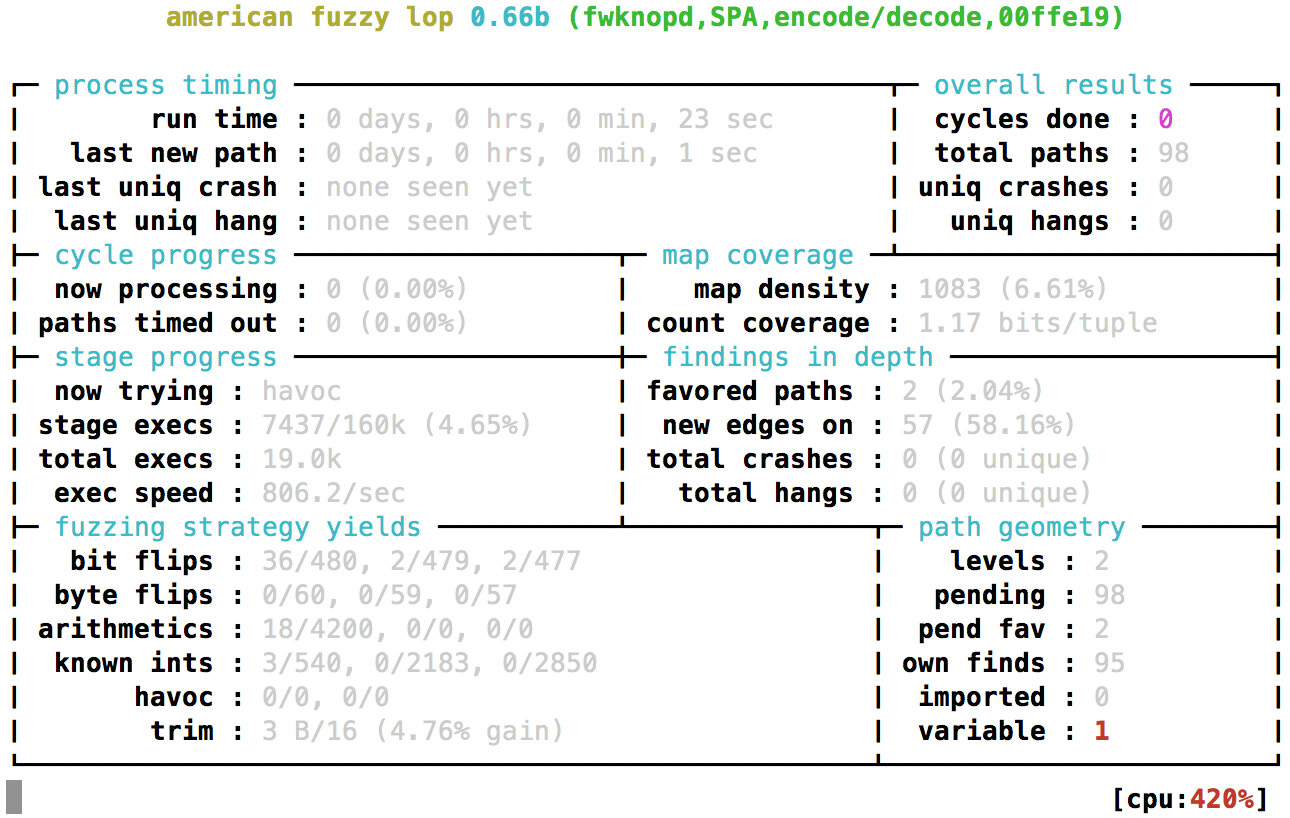
And now AFL is up and running (note the git --abbrev-commit tag integrated into the text banner to make clear which code is being fuzzed): AFL SPA packets fuzzing If the fuzzing run is stopped by hitting Ctrl-C, it can always be resumed as follows:
$ ./fuzzing-wrappers/spa-pkts.sh resume
Although major areas in fwknop where data is consumed are effectively fuzzed with AFL, there is always room for improvement. With the wrapper scripts in place, it is easy to add new support for fuzzing other functionality in fwknop. For example, the digest cache file (used by fwknopd to track SHA-256 digests of previously seen SPA packets) is a good candidate.

UPDATE (11/30/2014): The suggestion above about fuzzing the digest cache file proved to be fruitful, and AFL discovered a bounds checking bug that has been fixed in this commit. The next release of fwknop (2.6.5) will contain this fix and will be made soon.

Taking things to the next level, another powerful technique that would make an interesting side project would be to build a syntax-aware version of AFL that handles SPA packets and/or configuration files natively. The AFL documentation hints at this type of modification, and states that this could be done by altering the fuzz_one() routine in afl-fuzz.c. There is already a fuzzer written in python for the fwknop project that is syntax-aware of the SPA data format (see: spa_fuzzing.py), but the mutators within AFL are undoubtedly much better than in spa_fuzzing.py. Hence, modifying AFL directly would be an effective strategy.

Please feel free to open an issue against fwknop in github if you have a suggestion for enhanced integration with AFL. Most importantly, if you find a bug please let me know. Happy fuzzing!

Code Coverage: Challenges For Open Source Projects

In this blog post I'll pose a few challenges to open source projects. These challenges, among other goals, are designed to push automated test suites to maximize code coverage. For motivation, I'll present code coverage stats from the OpenSSL and OpenSSH test suites, and contrast this with what I'm trying to achieve in the fwknop project.

Stated bluntly, if comprehensive code coverage is not achieved by your test suite, you're doing it wrong.

With major bugs like Heartbleed and "goto fail", there is clearly a renewed need for better automated testing. As Mike Bland demonstrated, the problem isn't so much about technology since unit tests can be built for both Heartbleed and "goto fail". Rather, the problem is that the whole software engineering life cycle needs to embrace better testing.

1) Publish your code coverage stats

Just as open source projects publish source code, test suite code coverage results should be published too. The mere act of publishing code coverage - just as open source itself - is a way to engage developers and users alike to improve such results. Clearly displayed should be all branches, lines, and functions that are exercised by the test suite, and these results should be published for every software release. Without such stats, how can users have confidence that the project test suite is comprehensive? Bugs still crop up even with good code coverage, but many many bugs will be squashed during the development of a test suite that strives to exercise every line of source code.

For a project written in C and compiled with gcc, the lcov tool provides a nice front-end for gcov coverage data. lcov was used to generate the following code coverage reports on OpenSSL-1.0.1h, OpenSSH-6.6p1, and fwknop-2.6.3 using the respective test suite in each project:

Hit Total Coverage
OpenSSL-1.0.1h Lines: 44604 96783 46.1 %
Full code coverage report Functions: 3518 6574 53.5 %
Branches: 22653 67181 33.7 %

OpenSSH-6.6p1 Lines: 18241 33466 54.5 %
Full code coverage report Functions: 1217 1752 69.5 %
Branches: 9362 22674 41.3 %

fwknop-2.6.3 Lines: 6971 7748 90.0 %
Full code coverage report Functions: 376 377 99.7 %
Branches: 4176 5239 79.7 %


The numbers speak for themselves. To be fair, fwknop has a much smaller code base than OpenSSL or OpenSSH - less than 1/10th the size of OpenSSL and about 1/5th the size of OpenSSH in terms of lines reported by gcov. So, presumaby it's a lot easier to reach higher levels of code coverage in fwknop than the other two projects. Nevertheless, it is shocking that the line coverage in the OpenSSL test suite is below 50%, and not much better in OpenSSH. What are the odds that the other half of the code is bug free? What are the odds that changes in newer versions won't break assumptions made in the untested code? What are the odds that one of the next security vulnerabilities announced in either project stems from this code? Of course, test suites are not a panacea, but there are almost certainly bugs lying in wait within the untested code. It is easier to have confidence in code that has at least some test suite coverage than code that has zero coverage - at least as far as the test suite is concerned (I'm not saying that other tools are not being used). Both OpenSSL and OpenSSH use tools beyond their respective test suites to try and maintain code quality - OpenSSL uses Coverity for example - but these tools are not integrated with test suite results and do not contribute to the code coverage stats above. What I'm suggesting is that the test suites themselves should get much closer to 100% coverage, and this may require the integration of infrastructure like a custom fuzzer or fault injection library (more on this below).

On another note, given that an explicit design goal of the fwknop test suite is to maximize code coverage, and given the results above, it is clear there is significant work left to do.

2) Make it easy to automatically produce code coverage results

Neither OpenSSL nor OpenSSH make it easy to automatically generate code coverage stats like those shown above. One can always Google for the appropriate CFLAGS and LDFLAGS settings, recompile, and run lcov, but you shouldn't have to. This should be automatic and built into the test suite as an option. If your project is using autoconf, then there should be a top level --enable-code-coverage switch (or similar) to the configure script, and the test suite should take the next steps to produce the code coverage reports. Without this, there is unnecessary complexity and manual work, and this affects users and developers alike. My guess is this lack of automation is a factor for why code coverage for OpenSSL and OpenSSH is not better. Of course, it takes a lot of effort to develop a test suite with comprehensive code coverage support, but automation is low hanging fruit.

If you want to generate the code coverage reports above, here are two trivial scripts - one for OpenSSH and another for OpenSSL. This one works for OpenSSH:
#!/bin/sh
#
# Basic script to compile OpenSSH with code coverage support via gcc
# gcov and build HTML reports with lcov.
#

LCOV_DIR=lcov-results
LCOV_FILE=coverage.info
LCOV_FILTERED=coverage_final.info
PREFIX=~/install/openssh  ### tmp path

mkdir $LCOV_DIR

make clean
./configure --with-cflags="-fprofile-arcs -ftest-coverage" --with-ldflags="-fprofile-arcs -lgcov" --prefix=$PREFIX
make
make tests

### build coverage info and filter /usr/include/ files
lcov --capture --directory . --output-file $LCOV_FILE
lcov -r $LCOV_FILE /usr/include/\* --output-file $LCOV_DIR/$LCOV_FILTERED

### create the HTML report
genhtml $LCOV_DIR/$LCOV_FILTERED --output-directory $LCOV_DIR

exit

3) Integrate a fuzzer into your test suite

If your test suite does not achieve 99%/95% function/line coverage, architectural changes should be made to reach these goals and beyond. This will likely require that test suite drive a fuzzer against your project and measure how well it exercises the code base.

Looking at code coverage results for older versions of the fwknop project was an eye opener. Although the test suite had hundreds of tests, there were large sections of code that were not exercised. It was for this reason the 2.6.3 release concentrated on more comprehensive automated test coverage. However, achieving better coverage was not a simple matter of executing fwknop components with different configuration files or command line arguments - it required the development of a dedicated SPA packet fuzzer along with a special macro -DENABLE_FUZZING built into the source code to allow the fuzzer to reach portions of code that would have otherwise been more difficult to trigger due to encryption and authentication requirements. This is a similar to the strategy proposed in Michal Zalewski's fuzzer American Fuzzy Lop here (see the "Known Limitations" section).

The main point is that fwknop was changed to support fuzzing driven by the test suite as a way to extend code coverage. It is the strong integration of fuzzing into the test suite that provides a powerful testing technique, and looking at code coverage results allows you to measure it.

Incidentally, an example double free() bug that the fwknop packet fuzzer triggered in conjunction with the test suite can be found here (fixed in 2.6.3).

4) Further extend your code coverage with fault injection

Any C project leveraging libc functions should implement error checking against function return values. The canonical example is checking to see whether malloc() returned NULL, and if so this is usually treated as an unrecoverable error like so:
char *buf = NULL;
int size = 100;

if ((buf = malloc(size)) == NULL) {
    clean_up();
    exit(EXIT_FAILURE);
}
Some projects elect to write a "safe_malloc()" wrapper for malloc() or other libc functions so that error handling can be done in one place, but it is not feasible to do this for every libc function. So, how to verify whether error conditions are properly handled at run time? For malloc(), NULL is typically returned under extremely high memory pressure, so it is hard to trigger this condition and still have a functioning system let alone a functioning test suite. In other words, in the example above, how can the test suite achieve code coverage for the clean_up() function? Other examples include filesystem or network function errors that are returned when disks fill up, or a network communication is blocked, etc.

What's needed is a mechanism for triggering libc faults artificially, without requiring the underlying conditions to actually exist that would normally cause such faults. This is where a fault injection library like libfiu comes in. Not only does it support fault injection at run time against libc functions without the need to link against libfiu (a dedicated binary "fiu-run" takes care of this), but it can also be used to trigger faults in arbitrary non-libc functions within a project to see how function callers handle errors. In fwknop, both strategies are used by the test suite, and this turned up a number of bugs like this one.

Full disclosure: libfiu does not yet support code coverage when executing a binary under fiu-run because there are problems interacting with libc functions necessary to write out the various source_file.c.gcno and source_file.c.gcda coverage files. This issue is being worked on for an upcoming release of libfiu. So, in the context of fwknop, libfiu is used to trigger faults directly in fwknop functions to see how calling functions handle errors, and this strategy is compatible with gcov coverage results. The fiu-run tool is also used, but more from the perspective of trying to crash one of the fwknop binaries since we can't (yet) see code coverage results under fiu-run. Here is an example fault introduced into the fko_get_username() function:
/* Return the current username for this fko context.
*/
int 
fko_get_username(fko_ctx_t ctx, char **username)
{   
#if HAVE_LIBFIU
    fiu_return_on("fko_get_username_init", FKO_ERROR_CTX_NOT_INITIALIZED);
#endif
With the fault set (there is a special command line argument --fault-injection-tag on the fwknopd server command line to enable the fault), the error handling code seen at the end of the example below is executed via the test suite. For proof of error handling execution, see the full coverage report (look at line 240).
/* Popluate a spa_data struct from an initialized (and populated) FKO context.
*/
static int
get_spa_data_fields(fko_ctx_t ctx, spa_data_t *spdat)
{   
    int res = FKO_SUCCESS;

    res = fko_get_username(ctx, &(spdat->username));
    if(res != FKO_SUCCESS)
            return(res);

Once again, it is the integration of fault injection with the test suite and corresponding code coverage reports that extends testing efforts in a powerful way. libfiu offers many nice features, including thread safey, the ability to enable a fault injection tag relative to other functions in the stack, and more.

5) Negative valgrind findings should force tests to fail

So far, a theme in this blog post has been better code coverage through integration. I've attempted to make the case for the integration of fuzzing and fault injection with project test suites, and code coverage stats should be produced for both styles of testing.

A third integration effort is to leverage valgrind. That is, the test suite should run tests underneath valgrind when possible (speed and memory usage may be constraints here depending on the project). If valgrind discovers a memory leak, double free(), or other problem, this finding should automatically cause corresponding tests to fail. In some cases valgrind suppressions will need to be created if a project depends on libraries or other code that is known to have issues under valgrind, but findings within project sources should cause tests to fail. For projects heavy on the crypto side, there are some instances where code is very deliberately built in a manner that triggers a valgrind error (see Tonnerre Lombard's write up on the old Debian OpenSSL vulnerability), but these are not common occurrences and suppressions can always be applied. The average valgrind finding in a large code base should cause test failure.

Although running tests under valgrind will not expand code coverage, valgrind is a powerful tool that should be tightly integrated with your test suite.

Summary

  • Publish your code coverage stats
  • Make it easy to automatically produce code coverage results
  • Integrate a fuzzer into your test suite
  • Further extend your code coverage with fault injection
  • Negative valgrind findings should automatically force tests to fail

Validating libfko Memory Usage with Test::Valgrind

Validating libfko Memory Usage with Test::Valgrind The fwknop project consistently uses valgrind to ensure that memory leaks, double free() conditions, and other problems do not creep into the code base. A high level of automation is built around valgrind usage with the fwknop test suite, and a recent addition extends this even further by using the excellent CPAN Test::Valgrind module. Even though the test suite has had the ability to run tests through valgrind, previous to this change these tests only applied to the fwknop C binaries when executed directly by the test suite. Further, some of the most rigorous testing is done through the usage of the perl FKO extension to fuzz libfko functions, so without the Test::Valgrind module these tests also could not take advantage of valgrind support. Now that the test suite supports Test::Valgrind (and a check is done to see if it is installed), all fuzzing tests can also be validated with valgrind. Technically, the fuzzing tests have been added as FKO built-in tests in the t/ directory, and the test suite runs them through Test::Valgrind like this:
# prove --exec 'perl -Iblib/lib -Iblib/arch -MTest::Valgrind' t/*.t
Here is a complete example - first, run the test suite like so:
# ./test-fwknop.pl --enable-all --include perl --test-limit 3

[+] Starting the fwknop test suite...

    args: --enable-all --include perl --test-limit 3

[+] Total test buckets to execute: 3

[perl FKO module] [compile/install] to: ./FKO...................pass (1)
[perl FKO module] [make test] run built-in tests................pass (2)
[perl FKO module] [prove t/*.t] Test::Valgrind..................pass (3)
[valgrind output] [flagged functions] ..........................pass (4)

    Run time: 1.27 minutes

[+] 0/0/0 OpenSSL tests passed/failed/executed
[+] 0/0/0 OpenSSL HMAC tests passed/failed/executed
[+] 4/0/4 test buckets passed/failed/executed
Note that all tests passed as shown above. This indicates that the test suite has not found any memory leaks through the fuzzing tests run via Test::Valgrind. But, let's validate this by artificially introducing a memory leak and see if the test suite can automatically catch it. For example, here is a patch that forces a memory leak in the validate_access_msg() libfko function. This function ensures that the shape of the access request conforms to something fwknop expects like "1.2.3.4,tcp/22". The memory leak happens because a new buffer is allocated from the heap but is never free()'d before returning from the function (obviously this patch is for illustration and testing purposes only):
$ git diff
diff --git a/lib/fko_message.c b/lib/fko_message.c
index fa6803b..c04e035 100644
--- a/lib/fko_message.c
+++ b/lib/fko_message.c
@@ -251,6 +251,13 @@ validate_access_msg(const char *msg)
     const char   *ndx;
     int     res         = FKO_SUCCESS;
     int     startlen    = strnlen(msg, MAX_SPA_MESSAGE_SIZE);
+    char *leak = NULL;
+
+    leak = malloc(100);
+    leak[0] = 'a';
+    leak[1] = 'a';
+    leak[2] = '\0';
+    printf("LEAK: %s\n", leak);

     if(startlen == MAX_SPA_MESSAGE_SIZE)
         return(FKO_ERROR_INVALID_DATA_MESSAGE_ACCESS_MISSING);
Now recompile fwknop and run the test suite again, after applying the patch (recompilation output is not shown):
# cd ../
# make
# test
# ./test-fwknop.pl --enable-all --include perl --test-limit 3
[+] Starting the fwknop test suite...

    args: --enable-all --include perl --test-limit 3

    Saved results from previous run to: output.last/

    Valgrind mode enabled, will import previous coverage from:
        output.last/valgrind-coverage/

[+] Total test buckets to execute: 3

[perl FKO module] [compile/install] to: ./FKO...................pass (1)
[perl FKO module] [make test] run built-in tests................pass (2)
[perl FKO module] [prove t/*.t] Test::Valgrind..................fail (3)
[valgrind output] [flagged functions] ..........................fail (4)

    Run time: 1.27 minutes

[+] 0/0/0 OpenSSL tests passed/failed/executed
[+] 0/0/0 OpenSSL HMAC tests passed/failed/executed
[+] 2/2/4 test buckets passed/failed/executed

This time two tests fail. The first is the test that runs the perl FKO module built-in tests under Test::Valgrind, and the second is the "flagged functions" test which compares test suite output looking for new functions that valgrind has flagged vs. the previous test suite execution. By looking at the output file of the "flagged functions" test it is easy to see the offending function where the new memory leak exists. This provides an easy, automated way of memory leak detection that is driven by perl FKO fuzzing tests.
# cat output/4.test
[+] fwknop client functions (with call line numbers):
       10 : validate_access_msg [fko_message.c:256]
        6 : fko_set_spa_message [fko_message.c:184]
        4 : fko_new_with_data [fko_funcs.c:263]
        4 : fko_decrypt_spa_data [fko_encryption.c:264]
        4 : fko_decode_spa_data [fko_decode.c:350]
Currently, there are no known memory leaks in the fwknop code, and automation built around the Test::Valgrind module will help keep it that way.

Coverity Static Analysis and Open Source Software

Coverity Scan A few months ago Coverity announced that they would grant open source projects access to their "Scan" static analysis tool for free. This was certainly a bold move, and one that has the potential to improve the security landscape as more projects take advantage of it. The first time I had encountered Coverity was several years ago when Linux kernel ChangeLog entries were referencing Coverity's Scan tool as having found various classes of bugs in the kernel sources. This impressed me because the Linux kernel source code is not the easiest code to grok, and at the same time it is extremely widely deployed and audited so bugs get reported and fixed. Andrew Morton, second in command of the kernel, has pegged the time required to become proficient as a kernel developer at about one year of full time dedicated effort for an experienced systems programmer. Hence, any automated static analysis infrastructure that is good enough to find kernel bugs and have it credited in the kernel ChangeLog is a strong vote of confidence to my mind. Here is a recent instance of Coverity finding a NULL pointer dereference bug in Infiniband driver code for example.

Even though Coverity started being used by the Linux kernel development community circa 2005, Coverity was expensive and therefore not generally available to open source projects that typically do not have access to significant resources. Today, that has all changed with Coverity's open source initiative, and the community is better off. Simultaneously, Coverity also gets a benefit in terms of free press as more open source projects start using Coverity Scan. As of this writing, over 300 projects have signed up including fwknop, and Coverity maintains a list of these here. OpenVPN and OpenSSL are participating, but it doesn't look like OpenSSH is yet and I (for one) hope they do eventually.

Here is an example of a bug that Coverity found in the fwknop client:

index fea3679..2532669 100644 (file)
@@ -552,6 +552,7 @@ send_spa_packet_http(const char *spa_data, const int sd_len,
                 log_msg(LOG_VERBOSITY_ERROR,
                     "[-] proxy port value is invalid, must be in [%d-%d]",
                     1, MAX_PORT);
+                free(spa_data_copy);
                 return 0;
             }
         }


This is a classic memory leak bug in the fwknop client that is only triggered when an invalid port number is specified from the command line when sending SPA packet data through an HTTP proxy (this is not a widely used method for SPA packet transmission, but it is supported by the fwknop client along with other transmission modes). The spa_data_copy variable points to heap allocated memory that wasn't free()'d after the error condition was detected and before returning from the send_spa_packet_http() function call. Coverity was able to spot this bug through static analysis, and the diff output above shows the corresponding fix. In terms of other bugs found by Coverity, they have all been fixed in the current fwknop sources in preparation for the 2.5 release. A -pre release is available through the new Github releases feature, and will likely become 2.5 within a week: fwknop-2.5-pre3.tar.gz.

This same bug could also have been caught at run time with the excellent valgrind "memcheck" tool, but the invalid port number error would have had to be triggered in order for valgrind to detect the memory leak. While the fwknop test suite is fairly comprehensive and can automatically run every test underneath valgrind to help with the detection of memory leaks, not every error condition is triggered by the test suite and hence static analysis is quite important. At the same time, run time analysis is also important to pick up leaks and other problems that static analysis techniques may miss, so running valgrind will continue to be a critical test suite component.

Now, on the vulnerability research side, there are implications for vulnerability discovery. That is, source control changelogs that mention Coverity or other static analysis tools can help malicious actors find potentially exploitable code. Here is an example Github search that shows all issues where Coverity is mentioned. Is this a bad thing? Well, in a word I would say "no". The exploit community is constantly looking for ways to exploit software regardless of whether static analysis tools are used by project developers. The real problem is that bugs are frequently never discovered or fixed in the first place. Further, keeping bugs under wraps in a vein effort to hope they won't be found has never worked, and this is true regardless of whether a project is open source or not (binary patches released by Microsoft are reversed engineered to figure out how to exploit unpatched code for example). What we need is better, more security conscious software engineering - not imagined bug secrecy. Consistent, advertised usage of static analysis tools helps to drive this. In addition, static analysis tools should be seen as a piece of the bug hunting puzzle and be used in conjunction with other standard techniques such as dynamic analysis, unit tests, and good old fashioned code reviews.

Finally, in terms of Coverity's own competition such as Veracode, Klocwork, or Checkmarx, it seems to me that Coverity has made a shrewd move by offering code analysis to open source projects for free. They will continue to make important inroads into the OS community (which has become quite powerful over the past, say, 15 years and longer), and will most likely see a gain on the commercial side as a result.

The bottom line is that Coverity has an excellent static analysis product, and if you run or contribute to an open source project written in C/C++, you should be using Coverity Scan. It will likely find bugs that can certainly have security implications in your code. Even if Coverity doesn't turn up any bugs, additional verification is always a good thing - especially for security projects.

Switched from subversion to git

switched to git After using subversion for several years, I've switched to git for all cipherdyne.org projects. Subversion has certainly served its purpose, but it is hard to look at git and not feel a compelling draw. Further, with easy to set up web interfaces to git repositories such as gitweb and free hosting services such as github, providing a public git repository is trivial. Git itself can allow repositories to be cloned directly over HTTP without needing infrastructure like WebDAV, and here are links for the cipherdyne.org projects (github and gitweb links too):

The trac interface will remain active for a little while to see the legacy svn repositories, but the git repositories were all converted from these in order to preserve the history so trac is no longer important. If you are interested in the latest code changes in, say, fwsnort then just clone the repository and then you can make your own changes: $ git clone http://www.cipherdyne.org/git/fwsnort.git
Initialized empty Git repository in /home/mbr/tmp/git/fwsnort/.git/
$ cd fwsnort
$ git status
# On branch master
nothing to commit (working directory clean)
$ git show --summary
commit 00c4379a69975097948ed9e5ba356eeba69c0c93
Author: Michael Rash <mbr@cipherdyne.org>
Date: Mon Jun 20 21:00:57 2011 -0400

Added the --Conntrack-state argument

Added the --Conntrack-state argument to specify a conntrack state in place of
the "established" state that commonly accompanies the Snort "flow" keyword.
By default, fwsnort uses the conntrack state of "ESTABLISHED" for this. In
certain corner cases, it might be useful to use "ESTABLISHED,RELATED" instead
to apply application layer inspection to things like ICMP port unreachable
messages that are responses to real attempted communications. (Need to add
UDP tracking for the _ESTAB chains for this too - coming soon.)

RPM and a perl.req Heredoc Bug

RPM and a perl.req Heredoc Bug It looks like the Redhat Package Manager has a bug that in some corner cases where the dependencies of a perl program are not properly resolved. This happens whenever the perl program contains a particularly formatted embedded heredoc where a line within the heredoc text section begins with either the word use or require and is followed by any other word. Both "use" and "require" happen to be perl import statements, and the /usr/lib/rpm/perl.req script bundled with the RPM software does not make an exception for usages of these words within heredoc text. The end result is that whatever word follows either "use" or "require" is interpreted as a module dependency.

Here is an example of a heredoc section within a perl program that exposes the RPM dependency bug with line numbers included (this is derived from a modified version of the usage() text in the psad project, but please note that this has been fixed in psad; the example is just to show how to reproduce the bug):
1    print <<_HELP_;
2
3 psad: the Port Scan Attack Detector
4
5 Usage: psad [options]
6
7   --packets <number>      - Specify number of packets to
8                                   use in benchmark test (default is
9                                   10,000).
10  -U,  --USR1                   - Send a running psad process a USR1
11                                  signal (generates a dump of psad
12                                  data structures on STDOUT).
13
14 _HELP_
Note on line 8 above, the line begins with "use in benchmark" (ignoring the line number and the whitespace). The word after "use" is "in", and this is interpreted as a dependency by perl.req as illustrated below when trying to install an RPM out of psad with the heredoc text section above: [/usr/src/redhat/RPMS/i386]# rpm -ivvh psad-2.1.1-1.i386.rpm
D: package psad-2.1.1-1.i386 has unsatisfied Requires: perl(in)
D: Requires: perl(strict) YES (db provides)
D: Requires: perl(vars) YES (db provides)
D: Requires: perl(warnings) YES (db provides)
D: Requires: rpmlib(CompressedFileNames) <= 3.0.4-1 YES (rpmlib provides)
D: Requires: rpmlib(PayloadFilesHavePrefix) <= 4.0-1 YES (rpmlib provides)
D: Requires: rpmlib(VersionedDependencies) <= 3.0.3-1 YES (rpmlib provides)
D: Requires: rtld(GNU_HASH) YES (db provides)
D: opening db index /var/lib/rpm/Conflictname rdonly mode=0x0
D: closed db index /var/lib/rpm/Pubkeys
D: closed db index /var/lib/rpm/Depends
D: closed db index /var/lib/rpm/Conflictname
D: closed db index /var/lib/rpm/Providename
D: closed db index /var/lib/rpm/Basenames
D: closed db index /var/lib/rpm/Packages
D: closed db environment /var/lib/rpm/Packages
error: Failed dependencies:
perl(in) is needed by psad-2.1.1-1.i386
There is no "in" module, so it's no wonder the RPM installation fails. Unfortunately, this problem does not manifest itself when an RPM is built - only when it is installed.

The heredoc functionality is handy in perl, and allows a multi-line block of text to be faithfully reproduced without having to specify syntactic details such as newline characters in normal print statements. With a bug such as illustrated above, it can be hard to track down why certain RPM's do not install properly since heredoc text can be complex and verbose. It is usually easy to restructure the text so that neither "use" nor "require" begin a line, but only if you know that is the fundamental source of the problem.

Chances are that the RPM maintainers are already aware of this bug, but I will submit it to be sure that it hasn't slipped through the cracks.

Trailing Spaces and iptables LOG Prefixes

Trailing Spaces and iptables LOG Prefixes The iptables firewall offers verbose logging capabilities that generate syslog messages for IP packets, and these log messages include the header field values for nearly every interesting field in both the network and transport layer headers. The iptables logging function is implemented by two piece of code; one is the iptables userland binary that accepts a rule specified by the user with the LOG target, and the other is the in-kernel code that generates the appropriate klogd message when a packet matches a LOG rule within the kernel. The userland code that handles LOG rules is implemented by the file iptables/extensions/libipt_LOG.c in the iptables sources, and the kernel code that implements the LOG target is implemented by the file linux/net/ipv4/netfilter/ipt_LOG.c in the kernel sources.

A useful feature is that iptables LOG rules accept up to a 29-character string that is set by the user in order to add descriptive information to a log message when a packet triggers a LOG match. This is used by many open source projects to make iptables logs more effective when packets are logged. For example, fwsnort creates log prefixes such as "[1] REJ SID2180 ESTAB" when the Snort rule ID 2180 "P2P BitTorrent announce request" is detected by the fwsnort iptables policy. This prefix contains the rule number (1 in this case), shows that the TCP connection was terminated with a RST (indicated by the REJ string), and the original signature match took place over an established TCP connection (indicated by ESTAB).

This is all fine, but there is one minor wrinkle that affects many open source projects based around iptables: the LOG target does not enforce a trailing space character on log prefixes. This results in an unfortunate situation where the user can cause iptables to create log messages that break its own notion of tokens that define the shape of the log messages. For example, here is an iptables rule along with its resulting log message when a TCP SYN packet is sent to port 5001: # iptables -I INPUT 1 -p tcp --dport 5001 -j LOG --log-prefix "TEST"
Aug 28 22:04:43 minastirith kernel: TESTIN=eth0 OUT= MAC=00:13:d3:38:b6:e4:00:13:46:c2:60:44:08:00 SRC=192.168.10.3 DST=192.168.10.1 LEN=60 TOS=0x10 PREC=0x00 TTL=63 ID=56577 DF PROTO=TCP SPT=53479 DPT=5001 WINDOW=5840 RES=0x00 SYN URGP=0
Note the "TESTIN=eth0" string above. This string only exists because neither the ipt_LOG.c code distributed with the Linux kernel nor the libipt_LOG.c distributed with iptables adds a trailing space after the "TEST" string. If the rule had been built with "--log-prefix "TEST " (note the trailing space), then the log message would not break its own syntax.

Patches to enforce this behavior for this have been proposed before on the Netfilter development list, but they have not been accepted. The reason given is that the Netfilter maintainers don't want to break any parsers that are already coded to handle log prefixes without the space.

I understand this concern, but I respectfully submit that most major open source projects that build iptables policies add in the space already, and any parser that is worth its salt would therefore have to handle both cases. That is, parsers have to handle log prefixes that contain the trailing space and prefixes that omit it. In addition, all three of the shorewall, ipcop, and fwbuilder projects build in the trailing space to the log prefixes they generate, so parsers are already more likely to handle prefixes with the space than without it because these are popular projects for building iptables policies.

From now on, I will maintain a patch as a part of the psad project that modifies the iptables binary such that if the last character in a log prefix is not a space, then the code will add one automatically. A similar strategy could be implemented in the kernel, but it seems that a less invasive and a more easily deployed solution is to patch the iptables userland binary. A patch that implements this for iptables-1.3.8 has been checked into the psad source tree, and you can download it here. You can apply it as follows, and then recompile and install iptables: $ cd iptables-1.3.8
$ wget -O iptables-1.3.8_LOG_prefix_space.patch http://trac.cipherdyne.org/trac/psad/browser/psad/trunk/patches /iptables-1.3.8_LOG_prefix_space.patch?format=txt
$ patch -p0 < iptables-1.3.8_LOG_prefix_space.patch
patching file extensions/libipt_LOG.c
With this patch, all of your existing iptables scripts will function exactly as they always have; no additional space is added for any iptables log prefix that already has a trailing space - only those that are missing the space will be changed. It is my hope that the Netfilter project will incorporate this patch into iptables.

Profiling psad with Devel::DProf

The Devel::DProf perl module is a code profiler that builds detailed information about a piece of perl code at run time. This handy tool allows the relative time perl devotes to each subroutine to be recorded, and this information is valuable in the optimization process. Using Devel::DProf it is easy to determine the sections of code where psad spends most of its time. Because psad is written to detect as many network attacks as possible via iptables log messages, one might expect that psad devotes significant processing time to signature matching. Let us verify this by using the --Benchmark mode, which creates and sends 10,000 iptables log messages through the psad parsing and signature matching routines like so (note that this is against psad-2.0.4): # perl -d:DProf psad --Benchmark
Mon Feb 19 00:38:06 2007 [+] Entering benchmark mode.
Mon Feb 19 00:38:06 2007 [+] The --packets command line option was not specified.
Mon Feb 19 00:38:06 2007 [+] Defaulting to a 10,000 packet test.
Mon Feb 19 00:38:06 2007 [+] Creating packet array.
Mon Feb 19 00:38:06 2007 [+] check_scan()
Mon Feb 19 00:38:24 2007 [+] Err packets: -1.
Mon Feb 19 00:38:24 2007 [+] Packet creation and processing time: 18 sec.
Mon Feb 19 00:38:24 2007 [+] Exiting benchmark mode.
Now, a new file tmon.out is created in the local directory, and it can be examined using the dprofpp utility which displays perl code profile data:
# dprofpp tmon.out
Total Elapsed Time = 12.98063 Seconds
  User+System Time = 11.83063 Seconds
Exclusive Times
%Time ExclSec CumulS #Calls sec/call Csec/c  Name
 24.9   2.950 10.806  10001   0.0003 0.0011  main::match_sigs
 11.2   1.329  1.329 501050   0.0000 0.0000  main::check_sig_int_range
 11.1   1.320  1.320 160016   0.0000 0.0000  Net::IPv4Addr::ipv4_chkip
 9.13   1.080  1.110  10001   0.0001 0.0001  main::parse_NF_pkt_str
 9.04   1.070  2.390 160016   0.0000 0.0000  Net::IPv4Addr::ipv4_parse
 8.71   1.030  1.960  80008   0.0000 0.0000  Net::IPv4Addr::ipv4_network
 8.28   0.980 13.104      1   0.9799 13.104  main::check_scan
 6.25   0.740  4.470 110011   0.0000 0.0000  main::check_sig_ip
 6.09   0.720  3.387  20127   0.0000 0.0002  main::match_snort_keywords
 5.91   0.699  1.929 150140   0.0000 0.0000  \
main::match_snort_ip_keywords
 3.71   0.439  0.738  80133   0.0000 0.0000  \
main::match_snort_tcp_keywords
 2.62   0.310  3.730  40004   0.0000 0.0001  \
Net::IPv4Addr::ipv4_in_network
 1.69   0.200  0.200 110136   0.0000 0.0000  main::check_sig_ipopts
 1.44   0.170  0.180      1   0.1700 0.1799  main::import_snort_rules
 1.18   0.140  0.140  20002   0.0000 0.0000  main::check_range
From the above output it is easy to see that the match_sigs() function takes the largest percentage of processing time (24.9%) of any psad function. This function makes a good candidate for any optimization efforts. The next two functions check_sig_int_range() and Net::IPv4Addr::ipv4_chkip() (from the Net::IPv4Addr perl module) are dedicated to checking signature port numbers and IP address against iptables log messages. The parse_NF_pkt_str() is the main routine for parsing iptables log messages and building a hash that describes each log message field. This routine takes over 9% of psad's processing time, so optimizing the regular expressions psad uses to parse iptables log messages might provide a significant additional speedup.

Website Editing from the Perl Command Line

The cipherdyne.org website is completely maintained by a set of custom perl scripts for automatic editing of HTML pages, verifcation of page structure with XML::Simple, building release tarballs and RPM files of the cipherdyne.org software projects, and deploying the site to both staging and production web servers. Because a key requirement for this site is to run as few pieces of code as possible for security reasons, CGI scripts are kept to a minimum. All of the blog postings and pages dedicated to the four software projects available here (psad, fwknop, fwsnort, and gpgdir) are pure HTML that is edited and updated by a set of perl scripts. Note that there are excellent content management solutions out there such as Plone, Drupal, and Joomla for building complete database-driven websites for online communities and the like, but I do not yet need such a comprehensive solution.

Sometimes I run into a situation where I need to apply a global change to all of the cipherdyne.org HTML pages, and at the same time it is not necessary to update my perl scripts to account for the change because it affects content that only changes once. In this situation a single perl command with a judiciously chosen regular expression can do the trick.

For example, I include the meta tag revisit-after at the top of many of the HTML pages. Initially, I set the revisit time interval to 31 days like so: <meta name="revisit-after" content="31 days" /> However, because the cipherdyne.org site usually changes significantly more rapidly than this, I decided to shorten the time interval to two days. With a single perl command combined with the find and xargs command, every .html page in a directory structure (including recursively in all subdirectories) can be updated: $ find /path/to/webroot -name '*.html' | xargs perl -p -i -e 's|revisit-after"\s+content="31\s+days"|revisit-after" content="2 days"|' All of the cipherdyne.org pages are stored within a Subversion repository, so checking that the above command did the right thing is easy: $ svn diff 14.html
Index: 14.html
===================================================================
--- 14.html (revision 590)
+++ 14.html (working copy)
@@ -4,7 +4,7 @@
 <head>
 <meta http-equiv="Content-Type" content="application/xhtml+xml; charset=UTF-8" />
 <meta name="robots" content="all" />
-<meta name="revisit-after" content="31 days" />
+<meta name="revisit-after" content="2 days" />

 <title>Website Editing from the Perl Command Line<title>
One could argue that this information should be kept in a global header that is applied programmatically to all HTML pages. This way the "revisit-after" attribute would only have to be changed in one place for it to be applied to all HTML pages. This is a good argument for this particular class of change, but let us consider a more complex example. At one point I decided that I would like all links within the body of a blog posts (such as the one you are reading now) to be highlighted in bold characters. I had been doing this for some links by manually including "<b>" and "</b>" (bold) tags within the text portion of the standard "<a href=...>" tags. But, after deciding to make all links in bold characters, a simple change to the stylesheet used by cipherdyne.org could accomplish this without using the bold tags. However, all of the existing blog posts still contained links with the bold tags embedded, so I needed a quick way to remove them. Again, perl to the rescue: find /path/to/webroot/ -name '*.html' |xargs perl -p -i -e 'undef $/; s|<a\s+href=(.*?)> \s*<b>\s*(.*?)\s*</b>\s*</a>|<a href=$1>$2</a>|gs' This time things are a bit more complicated. Note the usage of "undef $/" so that each .html file is slurped into a single string so that the regex can match links that span multiple lines. Also, note the usage of the "?" which turns the .* into a non-greedy match so that only the minimal text that qualifies as valid link and descriptive text is matched for each link. A quick check against Subversion is in order to make sure the command worked properly: $ svn diff 2003/10/01.html Index: 2003/10/01.html =================================================================== --- 2003/10/01.html (revision 589) +++ 2003/10/01.html (working copy) @@ -42,7 +42,7 @@  <a class="link" href="/gpgdir/download/">download<a>  <br/><br/>  <div class="createdate">Posted by Michael Rash on 2003/10/01 -| <a href="/blog/categories/software-releases.html"><b> Software Releases</b></a> +| <a href="/blog/categories/software-releases.html">Software Releases</a>  <div>  <span class="article_separator">nbsp;<span>  <div>

Verifying Proper Memory Handling in psad with Valgrind

Valgrind Memory Validation I have started using the excellent Valgrind project to ensure the proper handling of heap allocated memory within the portions of psad that are written in C (kmsgsd, and psadwatchd). The following example is from psad-2.0.3, and please note that this bug is fixed in psad-2.0.4. For reference, kmsgsd is the psad daemon that is responsible for collecting iptables log messages from a named pipe that is written to by syslog.
Assuming that valgrind is installed, and the psad-2.0.3 sources are unpacked in the local directory, the first thing is to compile kmsgsd and psadwatchd in debug mode. This is just so that neither program calls fork() to become a daemon: $ cd psad-2.0.3
$ make debug
/usr/bin/gcc -Wall -g -DDEBUG kmsgsd.c psad_funcs.c strlcpy.c strlcat.c -o kmsgsd
/usr/bin/gcc -Wall -g -DDEBUG psadwatchd.c psad_funcs.c strlcpy.c strlcat.c -o psadwatchd
Now, let us run kmsgsd (as root) underneath valgrind (some output has been abbreviated): # valgrind --leak-check=full ./kmsgsd
==424== Memcheck, a memory error detector.
==424== Copyright (C) 2002-2007, and GNU GPL'd, by Julian Seward et al.
==424== Using LibVEX rev 1715, library for dynamic binary translation.
==424== Copyright (C) 2004-2007, and GNU GPL'd, by OpenWorks LLP.
==424== Using valgrind-3.2.2, dynamic binary instrumentation framework
. ==424== Copyright (C) 2000-2007, and GNU GPL'd, by Julian Seward et al.
==424== For more details, rerun with: -v
==424==
[+] Entering DEBUG mode
[+] Firewall messages will be written to both STDOUT _and_ to fwdata.

[+] parsing config_file: /etc/psad/kmsgsd.conf

==424== Invalid write of size 1
==424== at 0x804A165: strlcpy (strlcpy.c:52)
==424== by 0x8049763: parse_fw_search_file (kmsgsd.c:407)
==424== by 0x8048C53: main (kmsgsd.c:116)
==424== Address 0x415E350 is 0 bytes after a block of size 8 alloc'd
==424== at 0x401C5F1: malloc (vg_replace_malloc.c:149)
==424== by 0x8049736: parse_fw_search_file (kmsgsd.c:405)
==424== by 0x8048C53: main (kmsgsd.c:116)
So, it looks like the call to strlcpy() at kmsgsd.c line 407 is causing the problem. Indeed this code is the culprit: fw_msg_search[num_fw_search_strings] = (char *) malloc(strlen(tmp_fw_search_buf));
strlcpy(fw_msg_search[num_fw_search_strings], tmp_fw_search_buf, MAX_GEN_LEN);
The problem is that the strlcpy() function uses the size parameter (MAX_GEN_LEN in this case) as the size of the destination buffer. But, the above code shows that the size of the destination buffer is not MAX_GEN_LEN and is defined instead by a call to the strlen() function. Hence the fix is as follows (note the additional of the +1 as well to accomodate the ending NULL char and use of safe_malloc() which is a malloc() wrapper function - this is coming in psad-2.0.5): fw_msg_search[num_fw_search_strings] = (char *) safe_malloc(strlen(tmp_fw_search_buf)+1);
strlcpy(fw_msg_search[num_fw_search_strings], tmp_fw_search_buf, strlen(tmp_fw_search_buf)+1);
Because (to my knowledge) there has never been a crash in kmsgsd as a result of the bug above, it would have been hard to track down without a tool like valgrind.