psad Graphs of the Honeynet Scan30 Challenge
The Honeynet Scan30 results have long since been posted. The purpose of this page is not to duplicate that excellent work - it is designed to illustrate the power of visualizing security data to bolster security analysisAutomating the analysis of the Scan30 challenge iptables logfile was done with psad in logfile analysis mode ("psad -A -m <file>"). A portion of this output can be viewed online here: psad Scan30 analysis, or the complete version downloaded here: here.
All graphs on this page were generated by using psad in --CSV to send data to AfterGlow; the specific commands used appear after each graph below. The following color scheme applies to all graphs on this page:
| RED | - IP addresses external to the honeynet (attackers, scanners, etc.) |
| YELLOW | - Honeynet IP addresses |
| BLUE | - Port numbers (> 1024) |
| LIGHTBLUE | - Port numbers (<= 1024) |
Traffic Originating From the Honeynet
This graph shows all outbound traffic from the honeynet, and is one of the first things to check when looking for signs of a compromise. All IP addresses associated with the honeynet begin with 11.11.11.*. It is interesting that the host 11.11.11.67 shows up prominently in the middle of the graph, and represents the honeynet system that generated the most outbound traffic (logged by iptables that is), and connections to external web (port 80) and ftp (port 21) servers are seen coming from it. It is a good bet that this is a compromised system. Another interesting piece of information is the fact that the --log-prefix iptables command line argument was used to build the iptables logging rule, and psad has summarized all of the logging prefixes here.
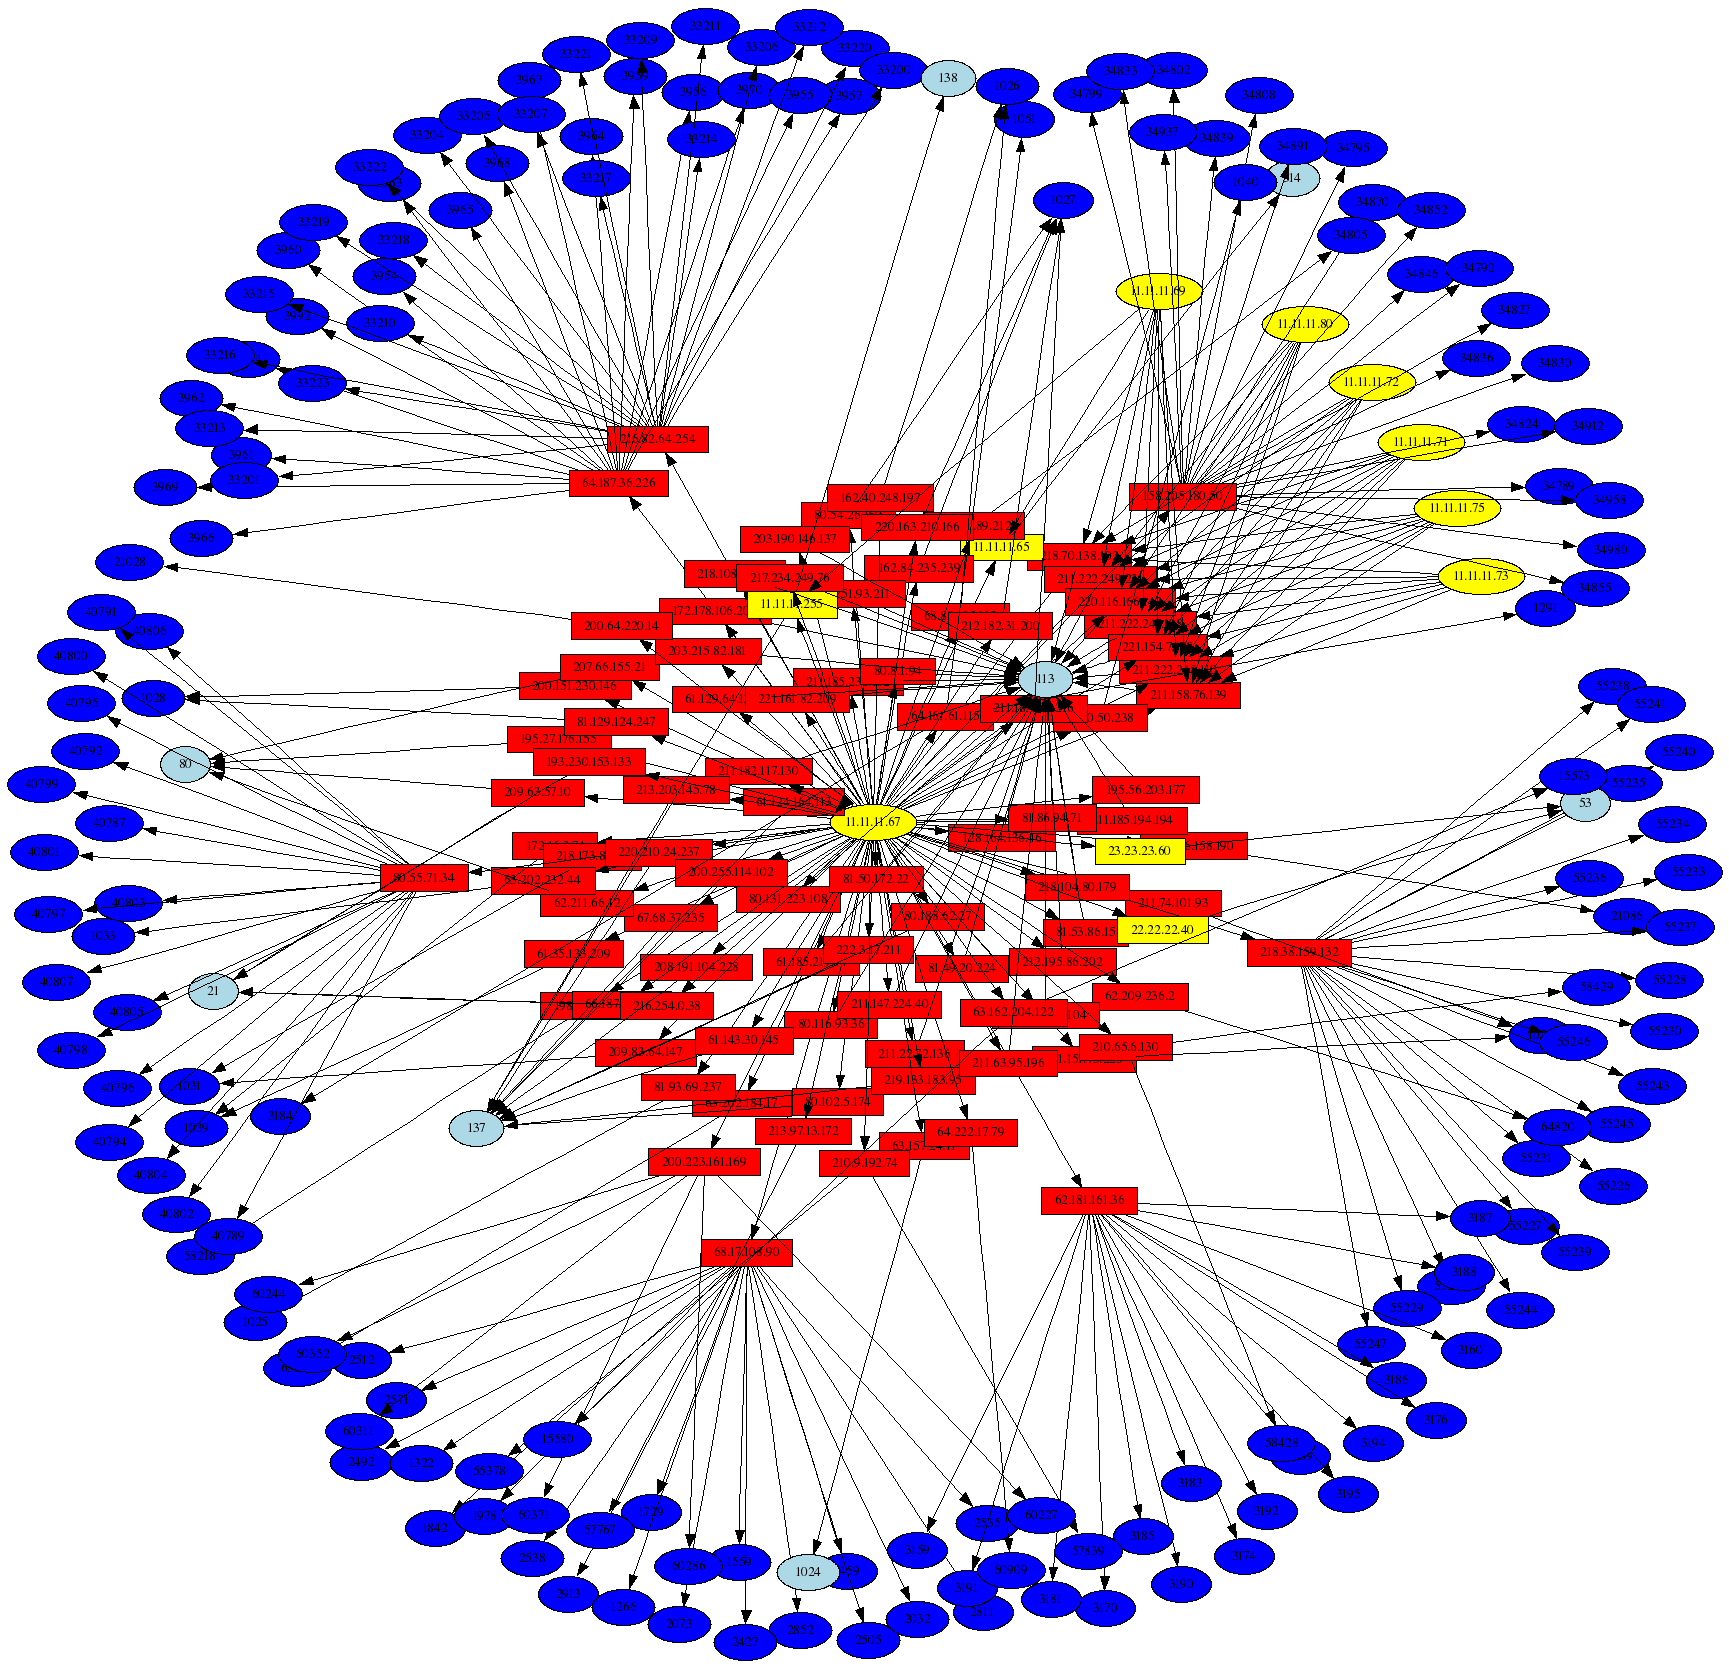 The graph above was generated with the following command:
# psad --CSV -m honeynet-Feb1_FebXX.log --CSV-fields "src:11.11.11.0/24 dst dp"
| perl afterglow.pl -c color.properties |neato -Tgif -o 11.11.11.0_subnet_src.gif
Compromised host: 11.11.11.67
The host 11.11.11.67 was compromised during the time period where the iptables logs were generated, and the following graph shows the hosts and ports it talked to (i.e. where SRC=11.11.11.67 in the iptables logs):
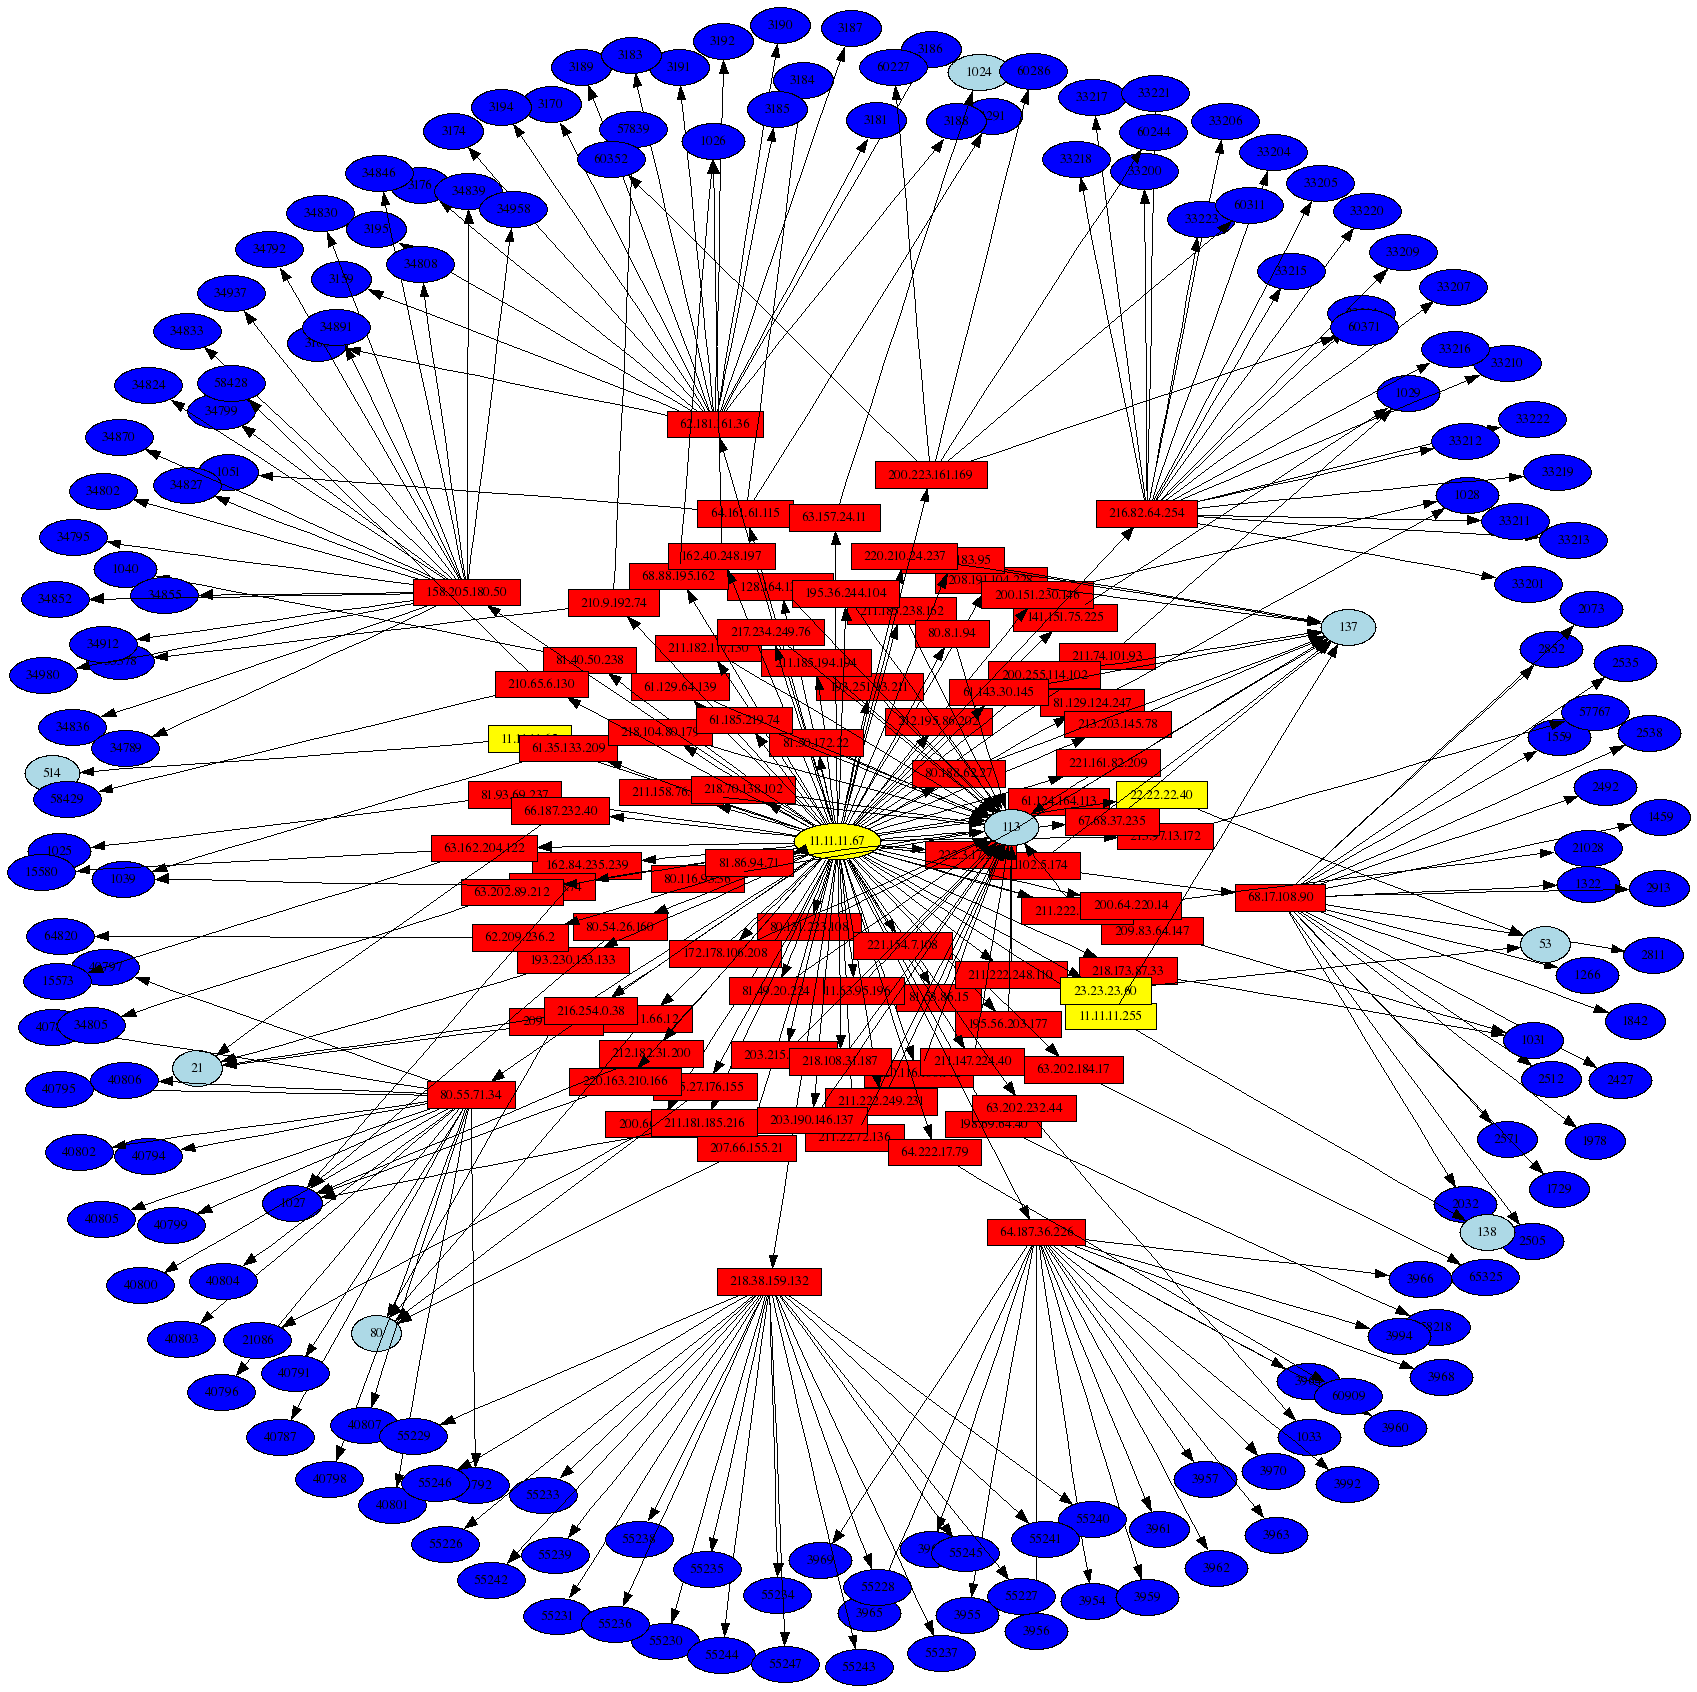 The graph above was generated with the following command:
# psad --CSV -m honeynet-Feb1_FebXX.log --CSV-fields "src:11.11.11.67 dst dp" --CSV-max 10000
| perl afterglow.pl -c color.properties |neato -Tgif -o 11.11.11.67_src.gif
Compromised host: 11.11.11.67 (continued)
This is another graph of the compromised host, but this time it shows instances where 11.11.11.67 is the destination address as well. Note the use of the psad --CSV-regex command line argument to allow either the Netfilter SRC or DST fields to match in the iptables logs:
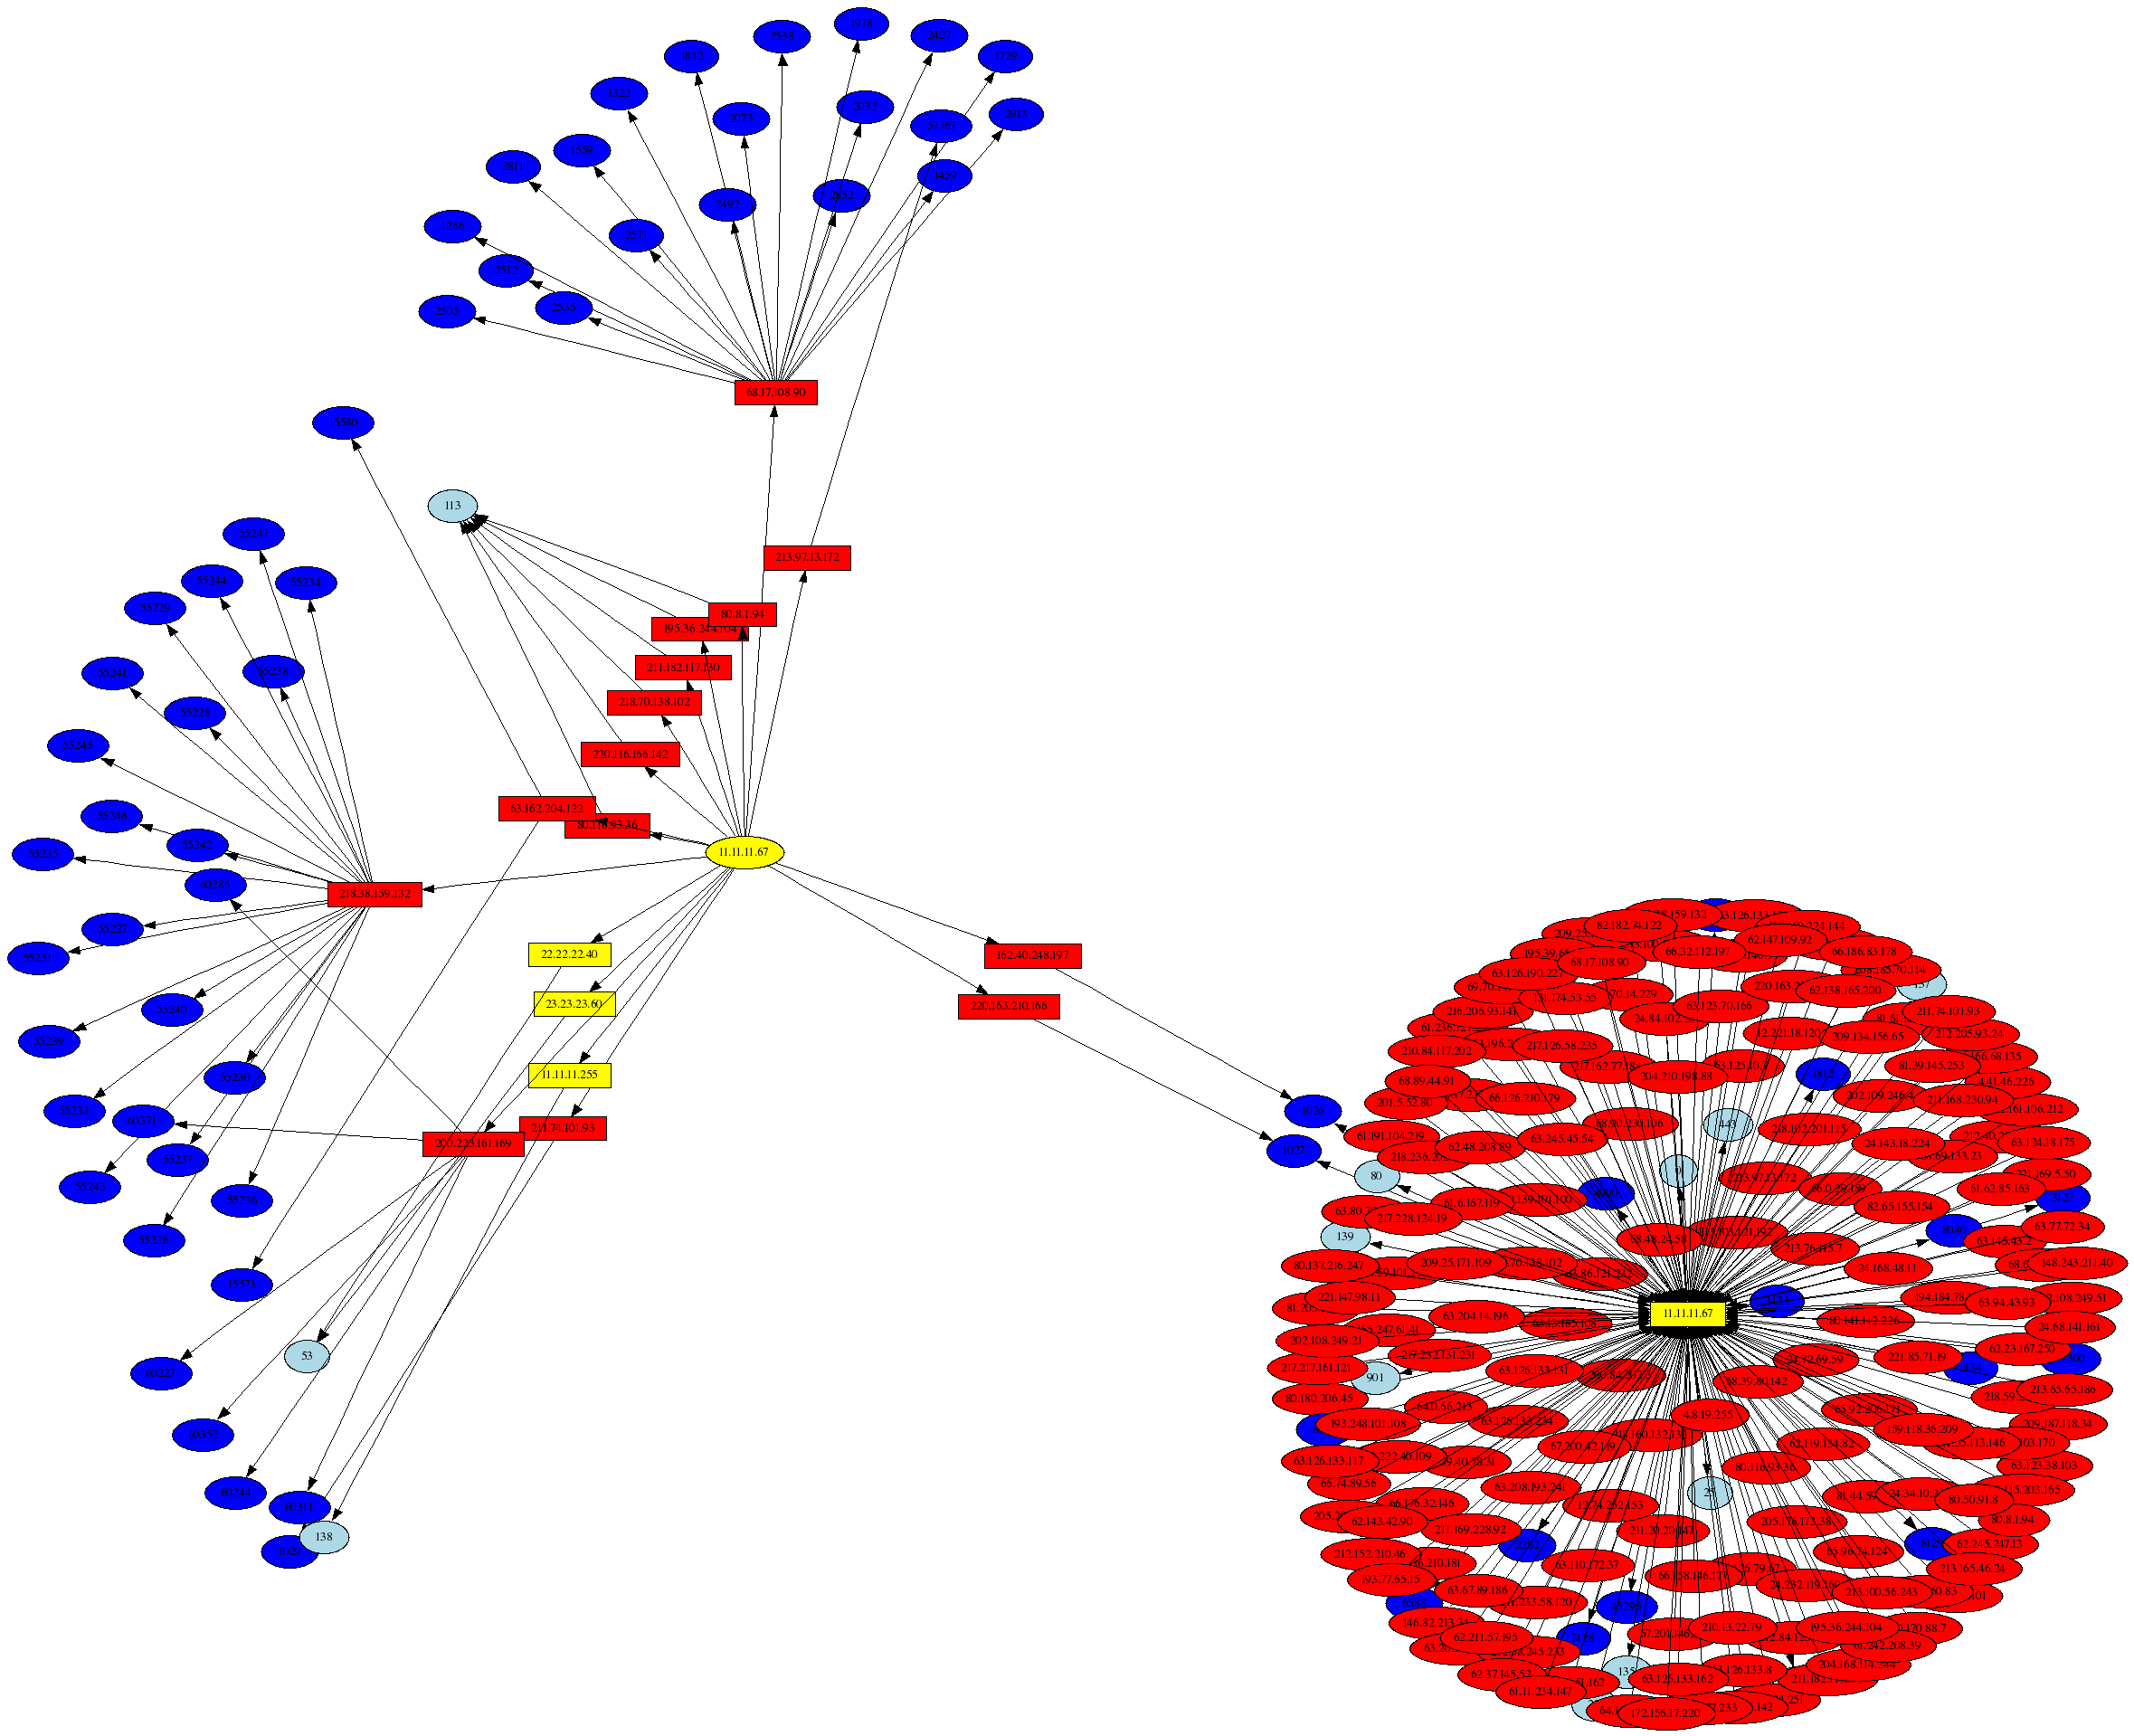 The graph above was generated with the following command:
# psad --CSV -m honeynet-Feb1_FebXX.log --CSV-fields "src dst dp" --CSV-regex 11.11.11.67
--CSV-max 12000   | perl afterglow.pl -c color.properties |neato -Tgif -o 11.11.11.67_src.gif
MyDoom Worm
The next graph shows traffic associated with the MyDoom worm. As before, the target IP addresses are shown in yellow, with the source IP addresses in red.
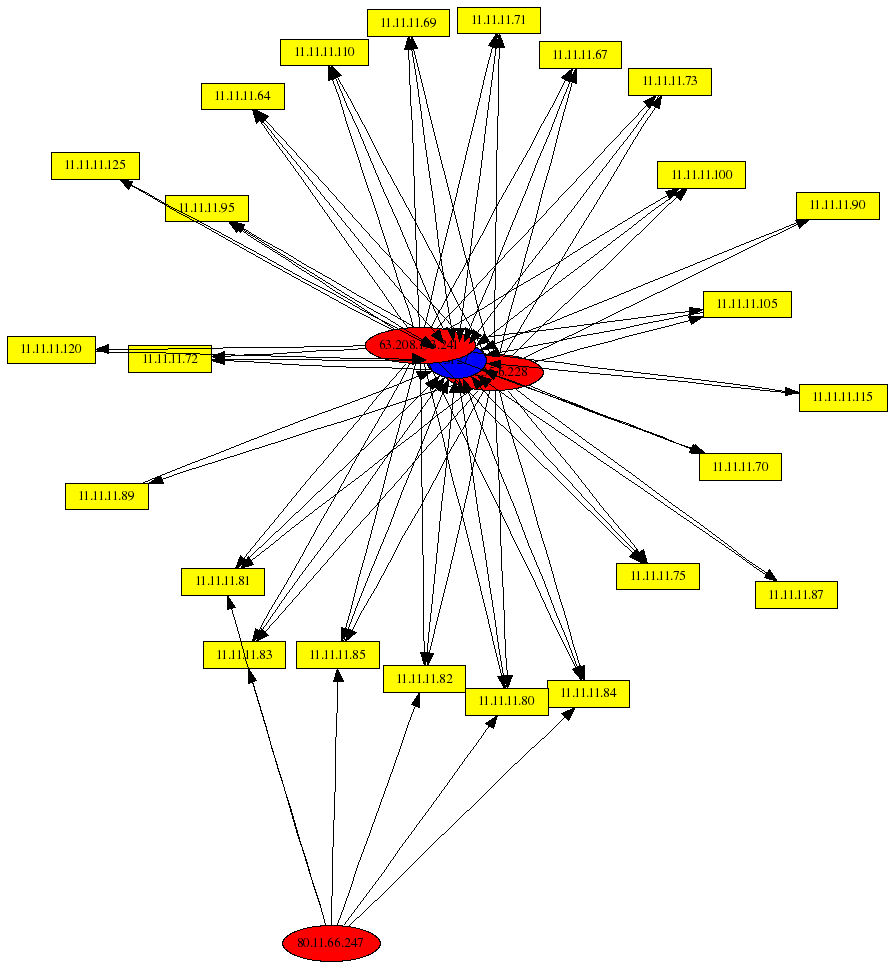 The graph above was generated with the following command:
# psad --CSV -m honeynet-Feb1_FebXX.log --CSV-fields "src dst dp:3127" --CSV-max 100
| perl afterglow.pl -c color.properties |neato -Tgif -o general.gif
MyDoom Against Single Target IP (11.11.11.72)
The next graph shows traffic associated with the MyDoom worm against the single target IP 11.11.11.72.
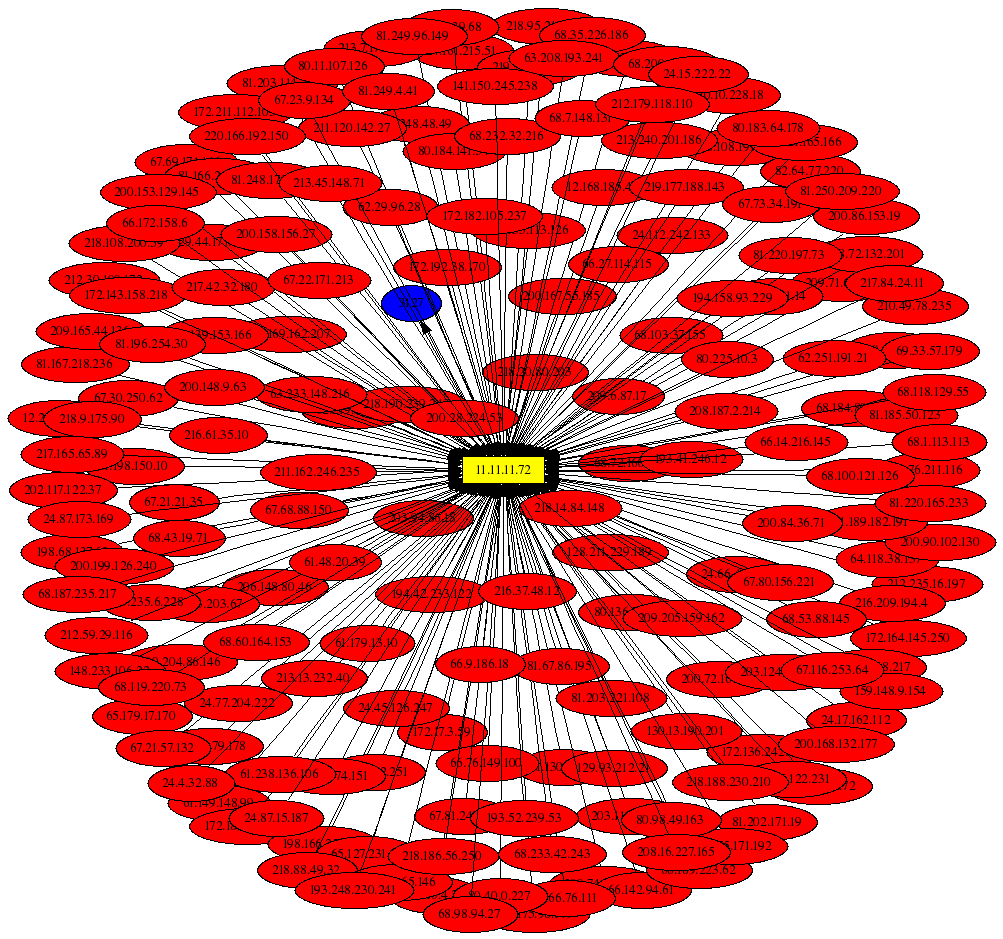 The graph above was generated with the following command:
# psad --CSV -m honeynet-Feb1_FebXX.log --CSV-fields "src dst:11.11.11.72 dp:3127"
--CSV-max 1000 | perl afterglow.pl -c color.properties |neato -Tgif -o general.gif
General Scans
The first graph below shows a selection of the scanning IP addresses (in red) and their target IP addresses (yellow) and port numbers (blue). In several cases, a single source address scans multiple target addresses, and the worst offenders are contained within the red clump in the middle of the yellow target addresses:
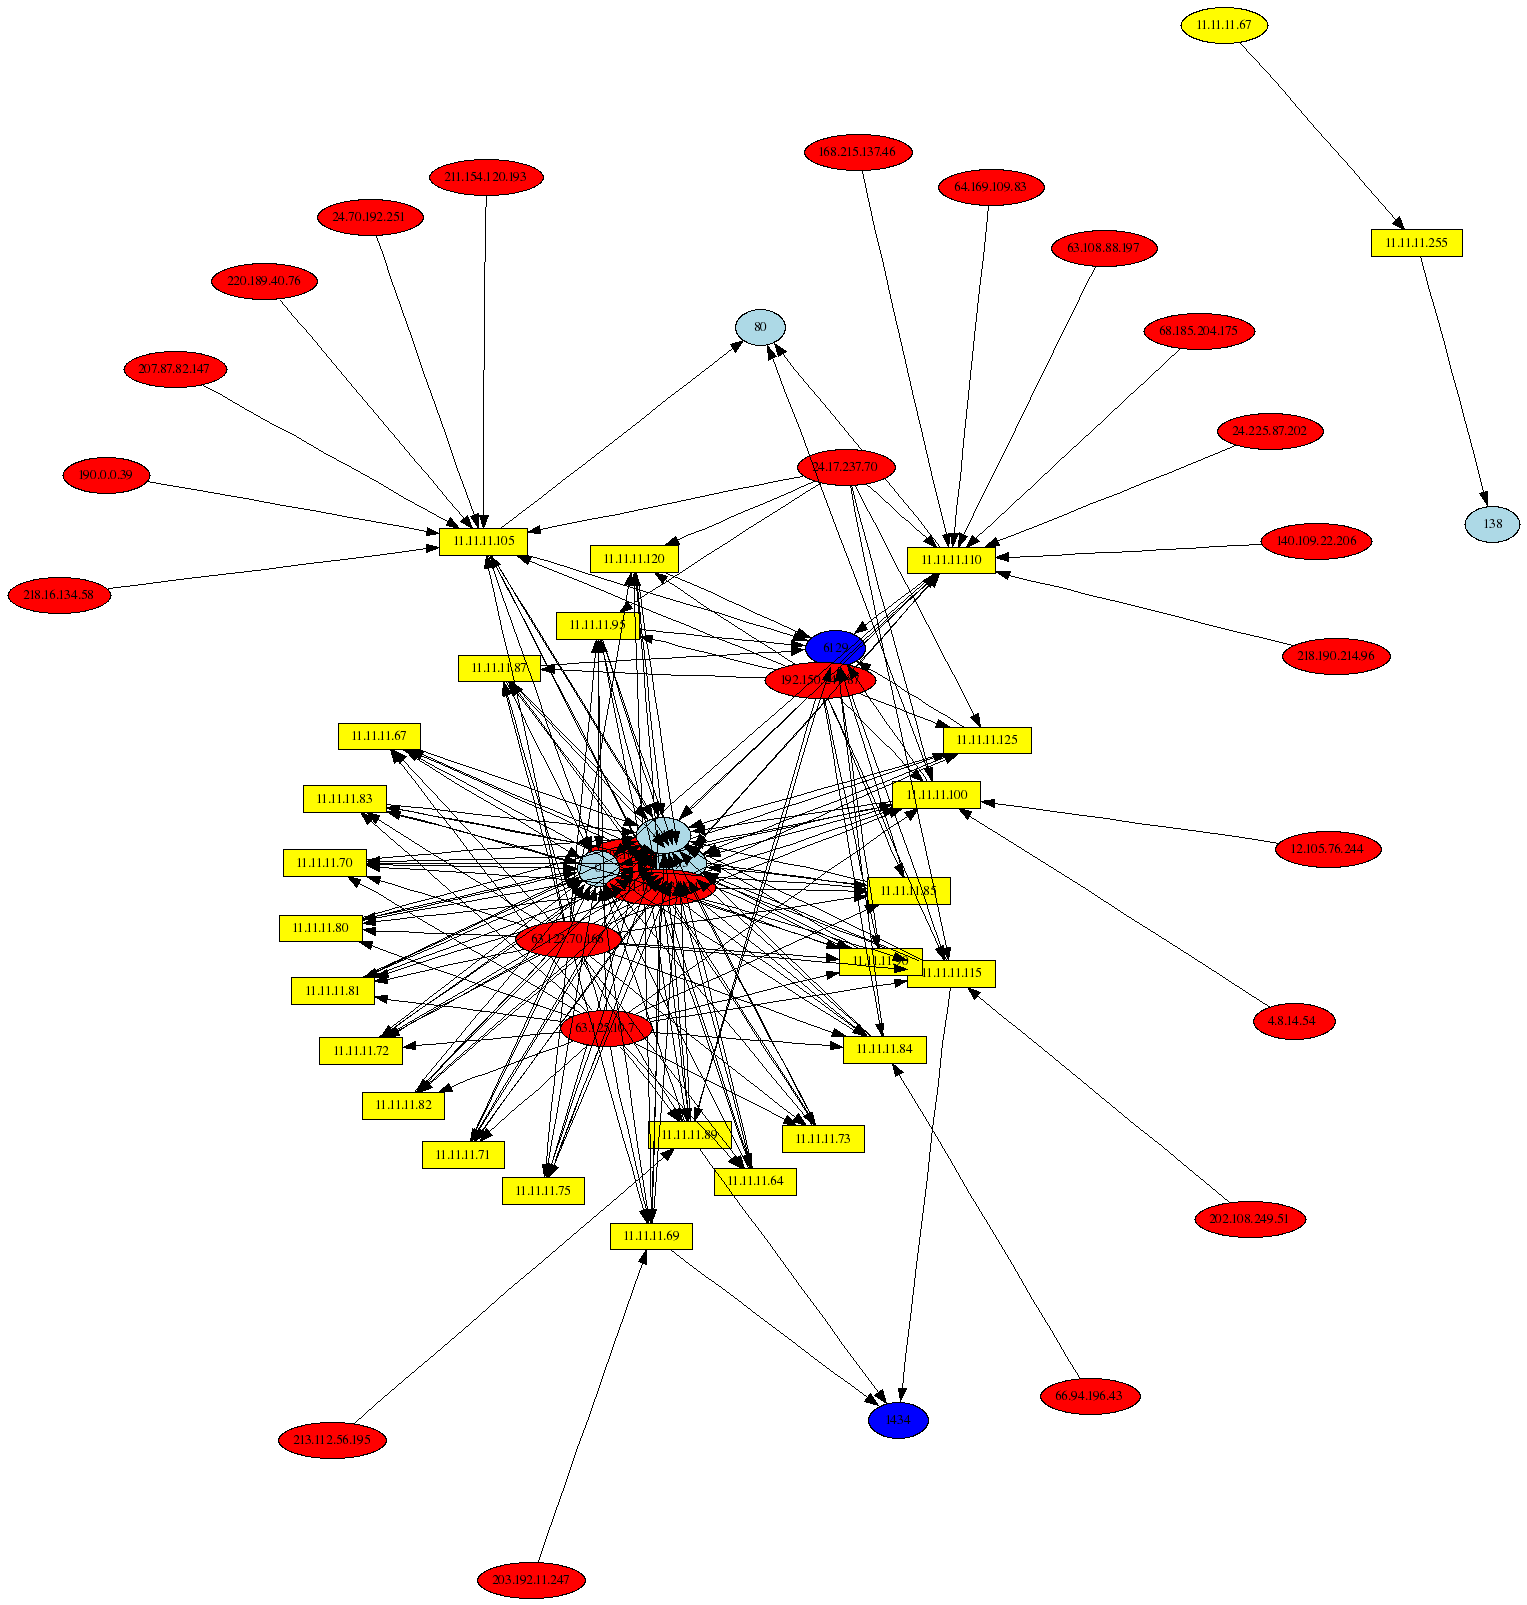 The graph above was generated with the following command:
# psad --CSV -m honeynet-Feb1_FebXX.log --CSV-fields "src dst dp" --CSV-max 200
| perl afterglow.pl -c color.properties |neato -Tgif -o general.gif
Windows Messenger Popup Spam
This graph displays UDP packets to port 1026 where the source port is a high port, and the len of the UDP header is at least 400 bytes (note the --CSV-regex accomplishes this search criteria against the Netfilter logs). Such traffic is commonly associated with attempts to send spam through the Windows Messenger service. In this example, it is interesting that most of the source IP addresses are within the range 64.191.71-77.*, and this may indicate a remote Botnet that is being used to send large amounts of spam:
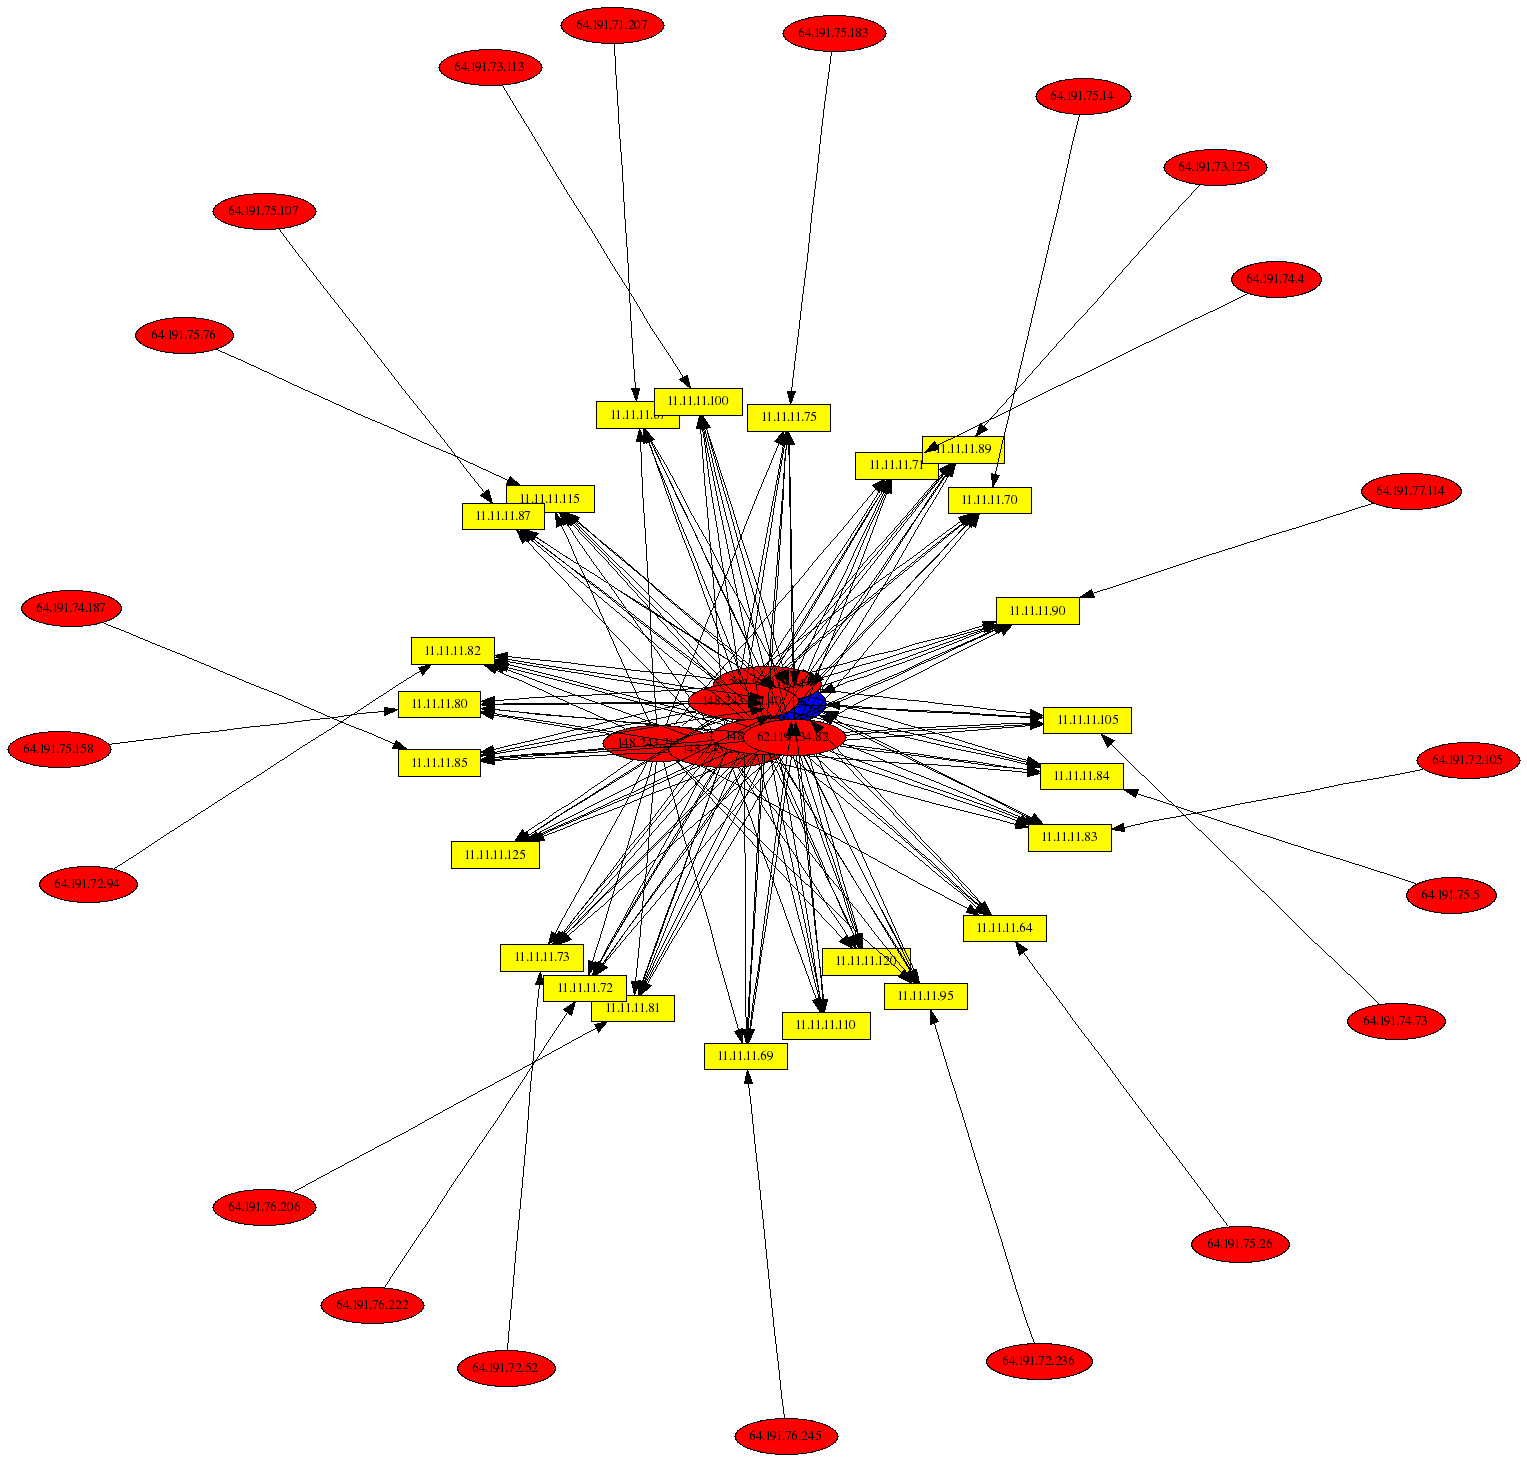 The graph above was generated with the following command:
# psad --CSV -m honeynet-Feb1_FebXX.log --CSV-fields "src dst dp:1026" --CSV-regex "SPT=\d{4}.*LEN=[4-9]\d{2}"
--CSV-max 200  | perl afterglow.pl -c color.properties |neato -Tgif -o 203.200.213.182.gif
Attacker: 203.200.213.182
One of the top attackers in this batch of iptables logs is 203.200.213.182, and the graphical representation below displays the unique ports scanned by this IP. Among the scanned ports are 3127, which is associated with the MyDoom worm.
 The graph above was generated with the following command:
# psad --CSV -m honeynet-Feb1_FebXX.log --CSV-fields "src:203.200.213.182 dst dp" --CSV-max 1000
| perl afterglow.pl -c color.properties |neato -Tgif -o 203.200.213.182.gif


